Blog 2
Building a Multi Account Patch Compliance Dashboard with Kiro Specs
References
- AWS Cloud Operations Blog: Build a Multi Account Patch Compliance Dashboard with Kiro Specs
- Author: Justin Thomas
- Published: June 9, 2026
Overview
Patch management is an important part of operating secure and reliable systems. It directly affects security posture, system stability, and compliance. When an environment only has a few servers or a few AWS accounts, tracking patch status can be simple. When an organization grows to dozens or hundreds of accounts, answering “how many instances are currently non-compliant?” becomes much harder.
The AWS blog introduces how to build a Multi Account Patch Compliance Dashboard using Kiro Specs. What I found interesting is that the article is not only about the dashboard itself. It also shows how spec-driven development can turn an operational requirement into architecture, implementation tasks, and a working codebase.
The dashboard uses AWS Systems Manager Patch Manager data through Resource Data Sync, aggregates the data in Amazon S3, and presents it through a private web interface. Users access the dashboard with AWS Systems Manager Session Manager port forwarding, so the solution does not need to expose a public endpoint to the internet.
Problem Context
AWS Systems Manager provides features such as Inventory, Explorer, and Compliance to help report managed node compliance. Resource Data Sync can export inventory and patch compliance data to Amazon S3. However, when the data comes from many accounts and Regions, manual reporting or reading thousands of raw S3 files every time the dashboard loads is not efficient.
A practical patch compliance dashboard needs to:
- Show total instances, compliance rate, compliant count, and non-compliant count quickly.
- Aggregate data across multiple AWS accounts.
- Let users drill down from an account to instance-level detail.
- Show which patches are missing and their severity.
- Avoid exposing the dashboard to the public internet.
- Remain cost-efficient with a serverless, pay-per-use model.
- Have a clear deployment process that is easy to validate and extend.
Solution Architecture
The original article proposes a serverless and private architecture focused on operations.
The main flow works like this:
- A user starts SSM Session Manager port forwarding to forward a local port to an internal Application Load Balancer through a bastion host.
- The user opens
https://localhost:8443/in the browser. - The request travels through the SSM tunnel to the bastion host and then to the internal Application Load Balancer in a private VPC.
- The ALB routes frontend requests to a Frontend Lambda, which serves the React application stored in the Dashboard S3 bucket.
- The React app calls APIs such as
/api/compliance-summaryor/api/compliance-detail. - The API Lambda reads pre-aggregated data from the
/cache/prefix in the Dashboard S3 bucket. - A Cache Compute Lambda runs every 30 minutes through Amazon EventBridge, reads raw data from the Resource Data Sync bucket, aggregates it, and writes JSON cache files to the Dashboard S3 bucket.
The important design choice is that the frontend does not read raw Resource Data Sync files directly. Raw data is transformed into pre-aggregated cache files first. This improves dashboard load time and keeps a clear separation between the source data bucket and the serving bucket.
AWS Services Involved
| Service | Role in the solution |
|---|---|
| AWS Systems Manager Patch Manager | Manages and collects patch compliance status for managed nodes |
| AWS Systems Manager Resource Data Sync | Exports inventory and compliance data to Amazon S3 |
| Amazon S3 | Stores raw compliance data, frontend assets, and aggregated JSON cache files |
| AWS Lambda | Handles frontend serving, API requests, and cache aggregation |
| Amazon EventBridge | Triggers the Cache Compute Lambda every 30 minutes |
| Application Load Balancer | Routes internal requests to Lambda targets |
| Amazon VPC | Hosts the private architecture with private subnets and internal ALB |
| Session Manager | Provides private dashboard access through port forwarding |
| AWS CloudFormation | Deploys buckets, network, compute, and supporting infrastructure |
| CloudWatch Logs / VPC Flow Logs / ALB logs | Provides operational logging and audit visibility |
Why This Architecture Prioritizes Security
The most important security point is that the dashboard is not public. Instead of using a public ALB or CloudFront distribution, a user must have valid AWS credentials and the correct SSM permissions to open the tunnel.
The article highlights several security decisions:
- Zero public attack surface: the ALB is internal-only, Lambda functions run in private subnets, and no public endpoint is exposed.
- Private-only access pattern: the dashboard fits enterprise environments where internal tools must not be accessible from the internet.
- Strict data separation: the Resource Data Sync bucket is used only as a read source, while a separate Dashboard S3 bucket stores cache and frontend assets.
- Encryption in transit and at rest: the ALB uses HTTPS, S3 encryption is enabled, and bucket policies can deny non-TLS requests.
- Comprehensive logging: VPC Flow Logs, ALB access logs, and CloudWatch Log Groups support monitoring and audit.
In my view, this is a reasonable design because a compliance dashboard contains sensitive operational information: which accounts have unpatched instances, which platforms are affected, and how severe the missing patches are. If this dashboard were exposed incorrectly, it could give attackers useful information.
Kiro Specs and Spec-Driven Development
The most interesting part of the article is how Kiro is used to build the solution with spec-driven development. Instead of prompting an AI assistant to write code immediately, Kiro breaks the work into three phases:
- Requirements: define what needs to be built, what the dashboard must display, and what the acceptance criteria are.
- Design: define architecture, data flow, component responsibilities, API contracts, and cache schemas.
- Tasks: break the implementation into ordered tasks.
This workflow reduces risk when using an AI coding assistant. If the process jumps straight to code, the generated solution may choose the wrong architecture, expose a public endpoint, or process data inefficiently. With Kiro Specs, important decisions are documented first and implementation follows those decisions.
Steering Files: Keeping Context for AI
The article uses steering files in the .kiro/steering/ folder. These are Markdown files that Kiro automatically includes in context. Their purpose is to avoid repeatedly explaining project conventions, architecture, and security rules during every interaction.
The main steering files are:
- architecture.md: describes the internal ALB, Lambda targets, private VPC, SSM access, EventBridge cache refresh, and Lambda settings.
- data-schemas.md: describes Resource Data Sync structures and cache formats for summary and detail views.
- compliance-logic.md: defines business rules, such as an instance being compliant only when
MissingCount = 0andInstalledPendingRebootCount = 0. - frontend-specs.md: describes layout, UI components, and Cloudscape Design System usage.
- security.md: defines security baselines such as HTTPS-only, S3 encryption, least-privilege IAM, security headers, input validation, and dependency pinning.
I think steering files are very practical. When working with AI, output quality depends heavily on context. If the context is written clearly in files, the assistant can generate requirements, design, and tasks more consistently.
MCP Servers for Validation
Steering files tell Kiro what to build, while MCP servers help validate what Kiro produces. The article recommends AWS MCP servers such as:
- Security Scanner MCP to scan for security issues.
- AWS IaC MCP Server to check Infrastructure as Code against AWS best practices.
The lesson for me is that AI should not only be used to generate code. It should also be paired with validation tools that review generated code, CloudFormation templates, and architecture choices.
What the Dashboard Displays
The dashboard is designed with two levels.
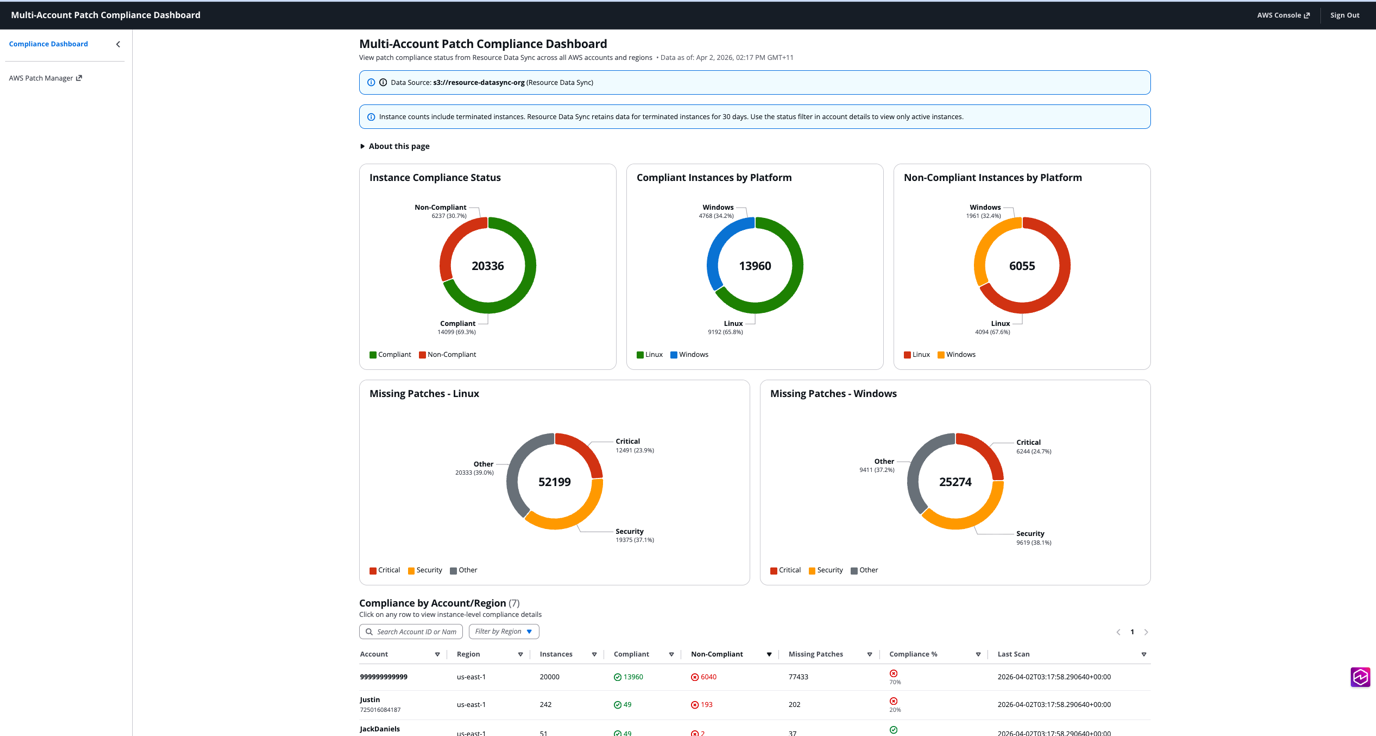
Source: AWS Cloud Operations Blog - Build a Multi Account Patch Compliance Dashboard with Kiro Specs
Main View
The main view helps an operations team answer high-level questions quickly:
- Total instances.
- Compliance rate.
- Number of compliant and non-compliant instances.
- Compliance status chart.
- Platform breakdown such as Linux or Windows.
- Missing patches by severity.
- Accounts table to identify which accounts need attention first.
Detail View
When a user clicks an account, the dashboard shows more detail:
- Instances in the account.
- Which instances are non-compliant.
- Number of missing patches.
- Last scan time.
- Specific missing patches and how many instances are affected.
This structure makes sense because operators usually need a high-level overview first, then they drill down into the accounts or instances that need action.
Deployment and Operations
The original article shows how Kiro can generate a deployment script for creating and deleting the resources. The deploy script builds the frontend, packages Lambda functions, deploys CloudFormation stacks in order, creates a self-signed TLS certificate for the internal ALB, uploads assets, updates Lambda code, and invokes the cache Lambda so the dashboard has data before users access it.
After deployment, the script prints an SSM port forwarding command similar to:
aws ssm start-session \
  --target <bastion-instance-id> \
  --document-name AWS-StartPortForwardingSessionToRemoteHost \
  --parameters '{"host":["<alb-dns-name>"],"portNumber":["443"],"localPortNumber":["8443"]}'
Then the user opens https://localhost:8443/ to access the dashboard.
The article also includes cleanup guidance to avoid ongoing charges, such as deleting CloudFormation stacks, emptying S3 buckets, and removing the VPC, ALB, Lambda functions, bastion instance, and ACM certificate.
Possible Extensions
The solution is a working foundation, not a final product for every organization. Some useful extensions include:
- Add Amazon Cognito authentication for multi-user access.
- Add server-side pagination for environments with more than 10,000 instances.
- Create custom widgets for organization-specific compliance metrics.
- Integrate with Amazon SNS for compliance alerts.
- Integrate with Amazon Inspector to show CVE details for missing patches.
What I Learned
Before reading this article, I thought of a compliance dashboard mostly as a frontend that displays data. After studying it, I realized the harder parts are data architecture and secure access.
If the dashboard reads raw S3 data every time it loads, it can become slow and more expensive as the number of accounts grows. Building a scheduled cache with Lambda and EventBridge separates heavy processing from user requests.
I also learned that Kiro Specs are useful when using AI to build systems with clear requirements. Instead of letting AI guess, the project provides steering files, requirements, design, and tasks. This makes the output easier to control, especially for sensitive areas such as IAM, private network access, and security baselines.
Conclusion
This article shows how AWS Systems Manager, Resource Data Sync, Lambda, S3, EventBridge, an internal ALB, and Session Manager can work together to build a private, serverless multi-account patch compliance dashboard.
The key point is not only the dashboard, but also the development process with Kiro Specs. When requirements, architecture, security rules, and tasks are clearly described from the beginning, an AI coding assistant can help implement faster while still keeping the solution controlled and reviewable.
For a real environment, I think the most important steps are standardizing Resource Data Sync, defining compliance logic clearly, designing private access from the start, and validating generated infrastructure before deploying to production.