CloudWatch Logs & Filters
PART 1: SET UP LOG RETENTION SETTING
- Create CloudWatch log groups, metric filters/custom metrics if needed.
Financial safety note (Cost Guardrails): AWS defaults to storing logs indefinitely (Never Expire), which will increase the Account’s storage costs. The documentation requires you to bring it down to 7 days.
Execute the following steps sequentially for all 6 group names:
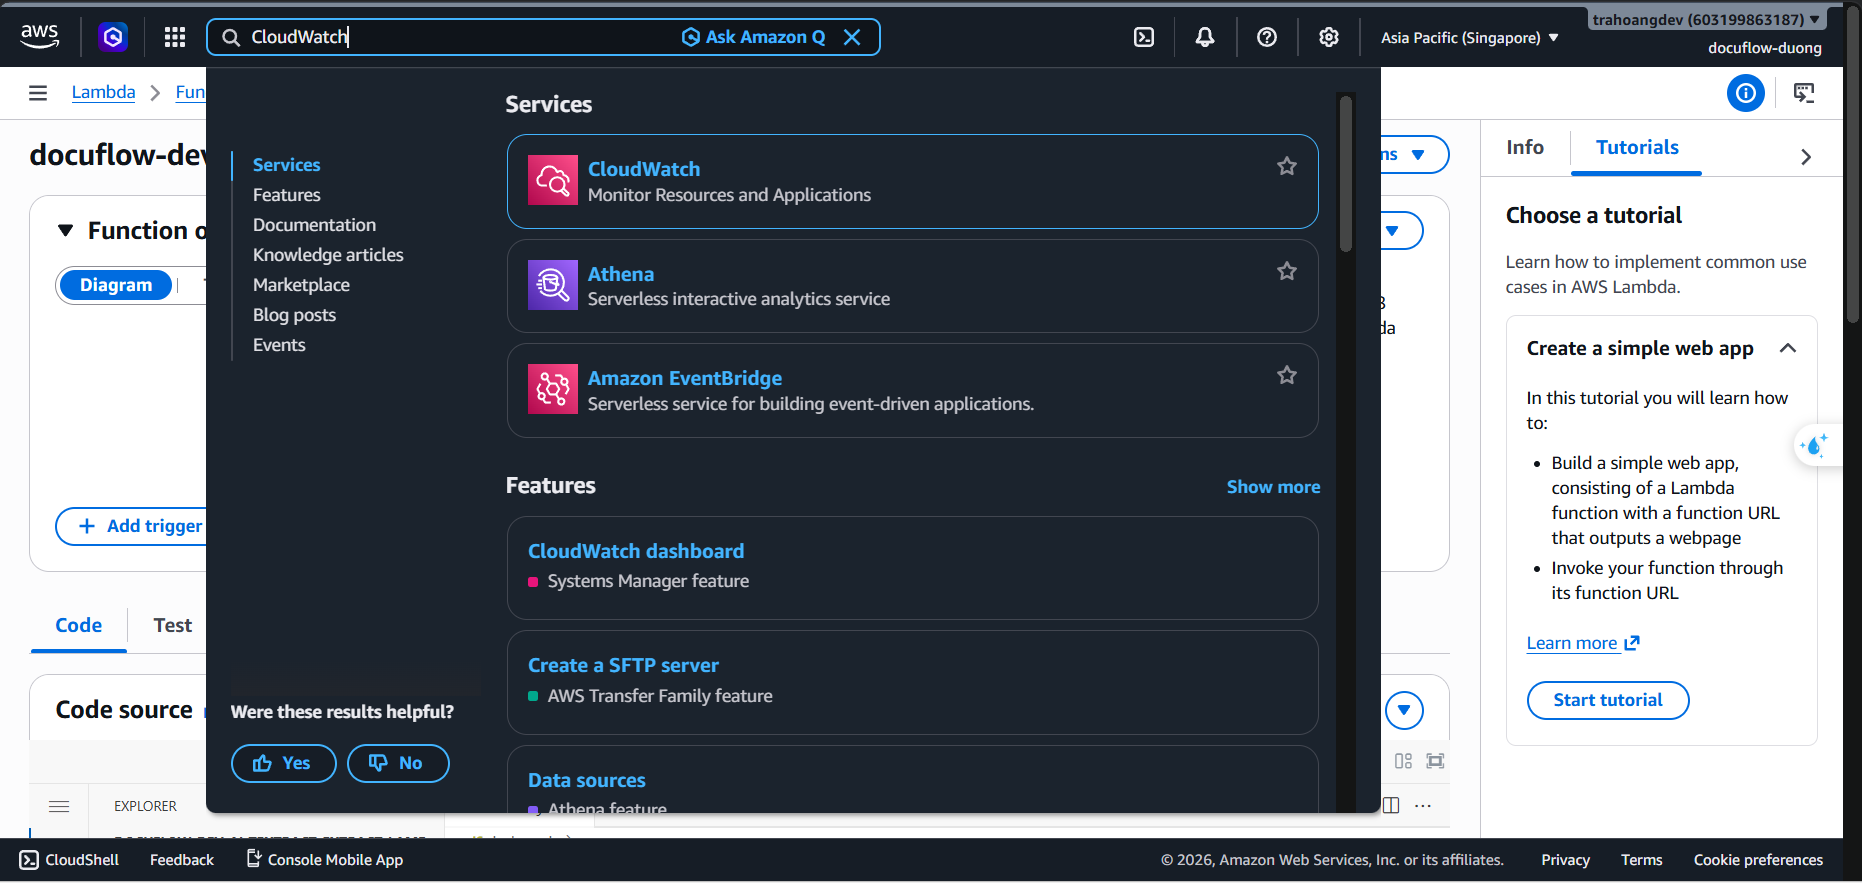
In the AWS Console search bar at the top, type CloudWatch ➔ Select the CloudWatch service.
On the left sidebar menu, find the Logs section ➔ Click Log groups.
Looking at the right corner of the screen, click the Create log group button.
Detailed configuration:
- Log group name: Copy exactly the first name:
/aws/lambda/docuflow-dev-ai-proxy-lambda - Retention setting: Click the dropdown menu, select 1 week (7 days).
- KMS key ARN: Leave blank (or paste the ARN of the
alias/docuflow-dev-main-keyif you want to encrypt logs according to the highest security standards).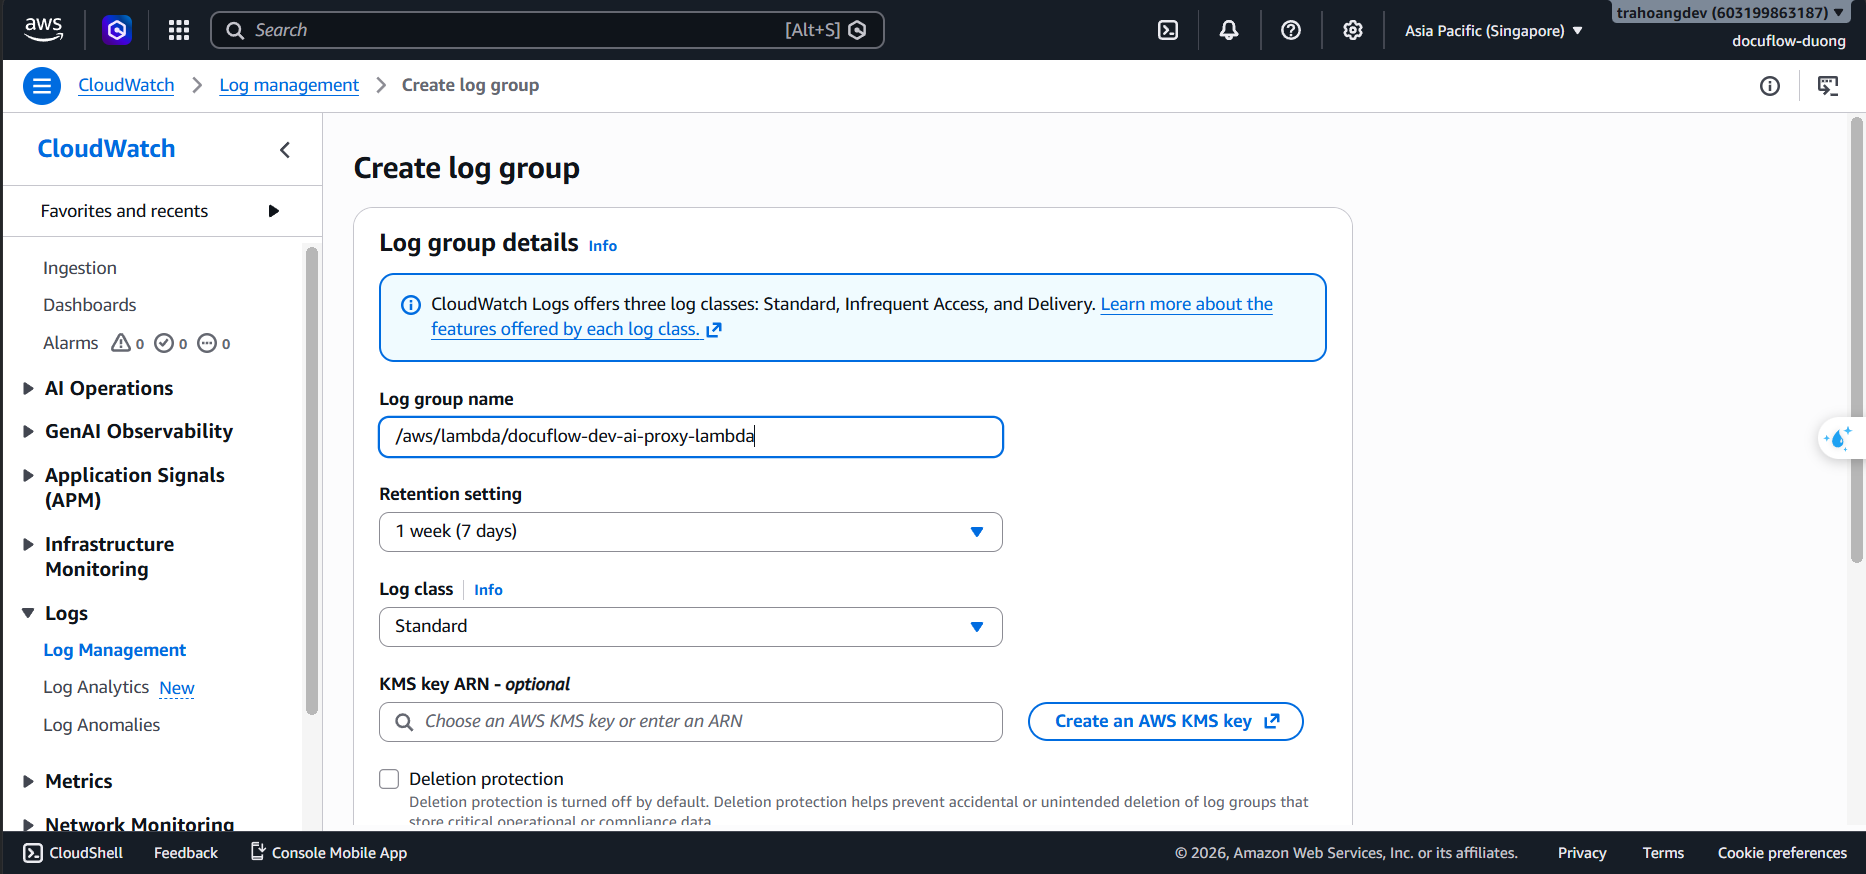
- Log group name: Copy exactly the first name:
Click the Create button at the bottom.
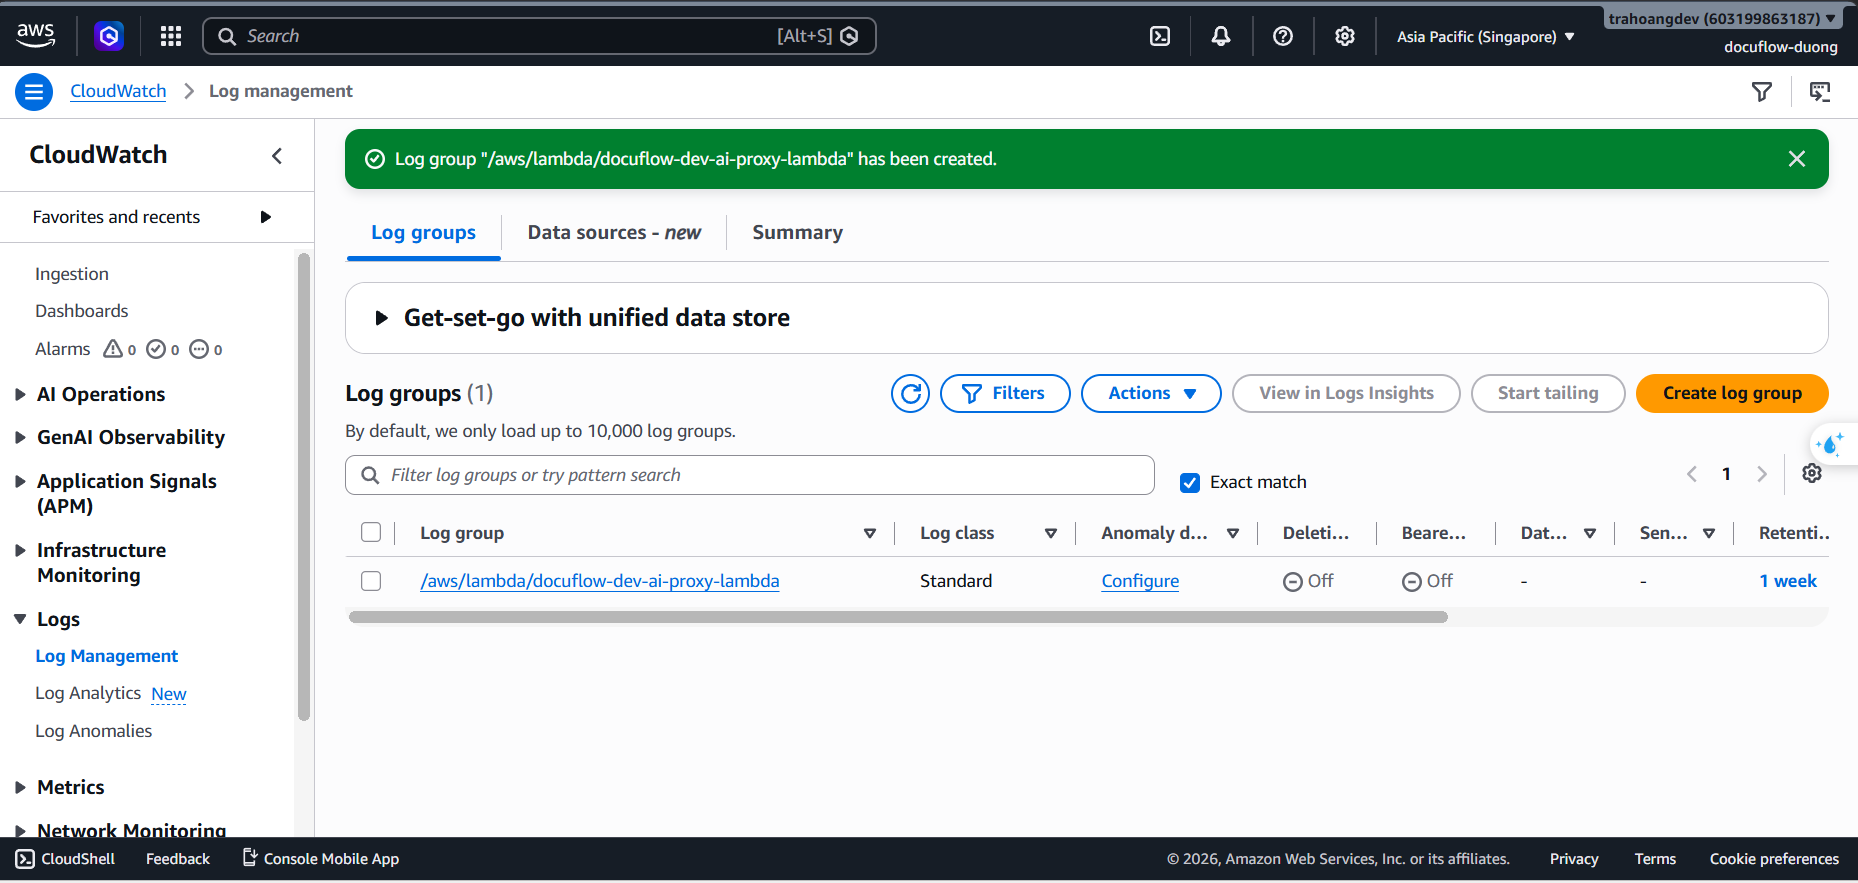
Repeat the exact steps above for the remaining 5 names:
/aws/lambda/docuflow-dev-ingestion-job-starter-lambda/aws/lambda/docuflow-dev-api-generate-upload-url-lambda/aws/lambda/docuflow-dev-ai-textract-lambda/aws/lambda/docuflow-dev-ai-confidence-status-lambda/aws/lambda/docuflow-dev-data-lambda
PART 2: CREATE METRIC FILTERS TO MONITOR IMPORTANT METRICS (CUSTOM METRICS)
To serve the Workshop/Demo for displaying visual charts, you need to extract metrics from Logs into Metrics. We will make 2 core filter sets:
Filter Set 1: Catch system errors errorType (Configured on Tai’s AI Proxy function)
This filter helps count the number of times the AI Proxy function fails when calling an external LLM or due to a code error.
- In the Log groups list, click directly on the group name:
/aws/lambda/docuflow-dev-ai-proxy-lambda. - Select the Metric filters tab (next to the Log streams tab) ➔ Click the Create metric filter button.
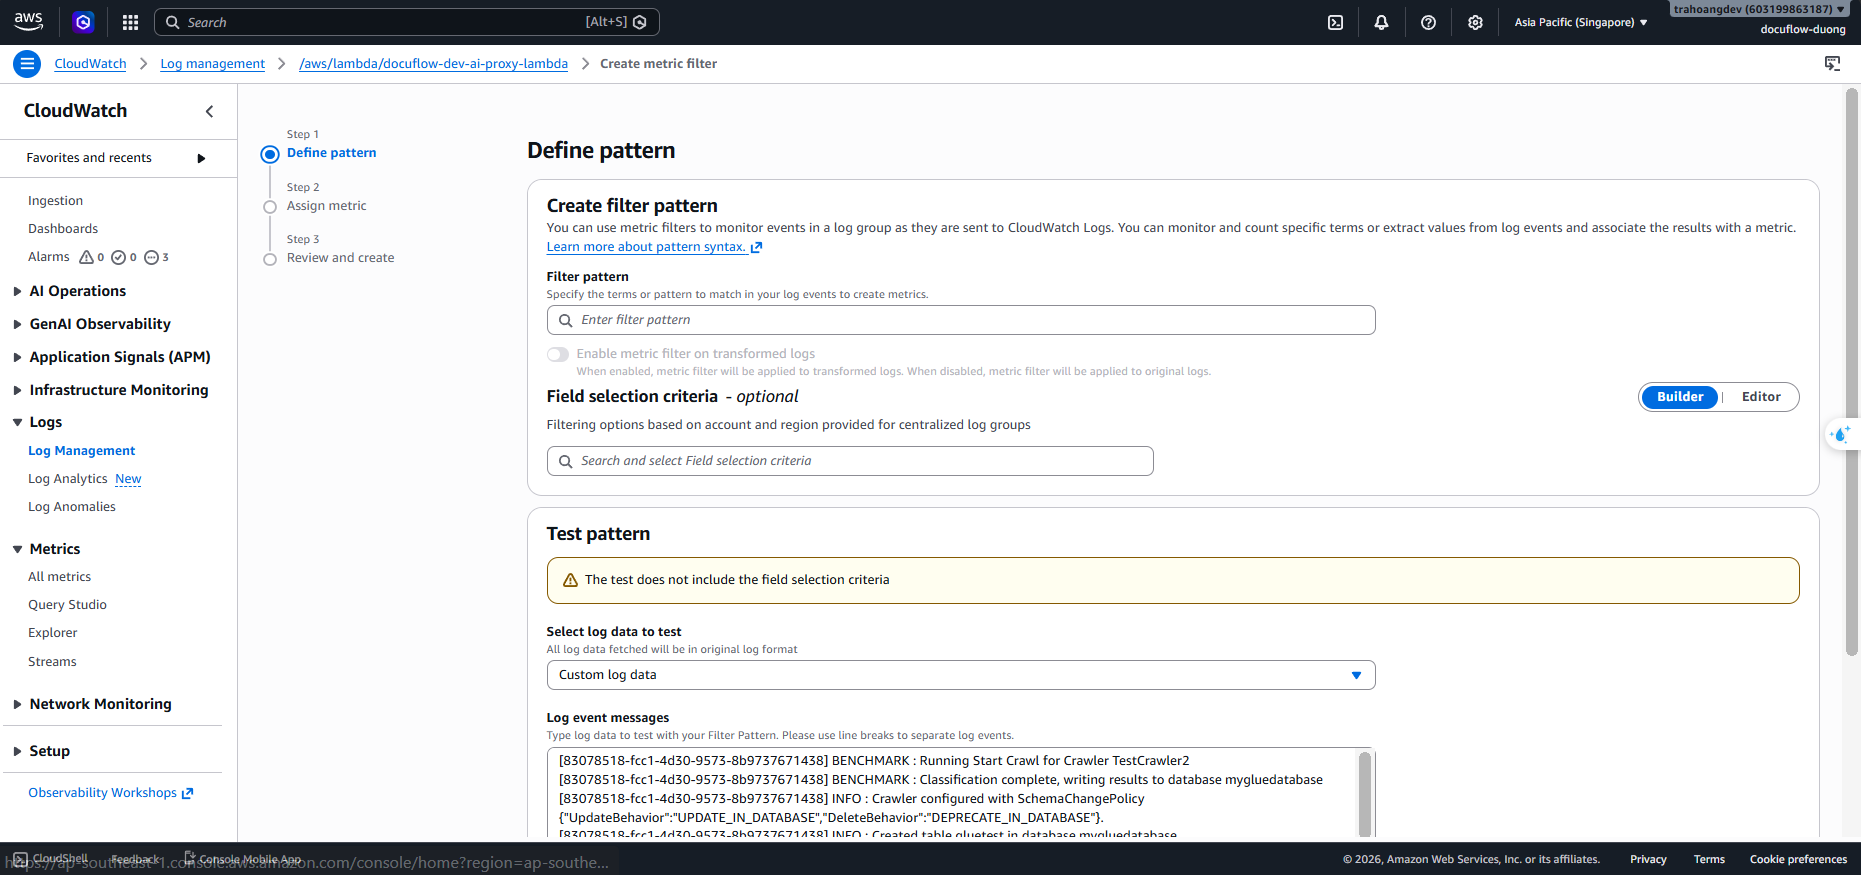
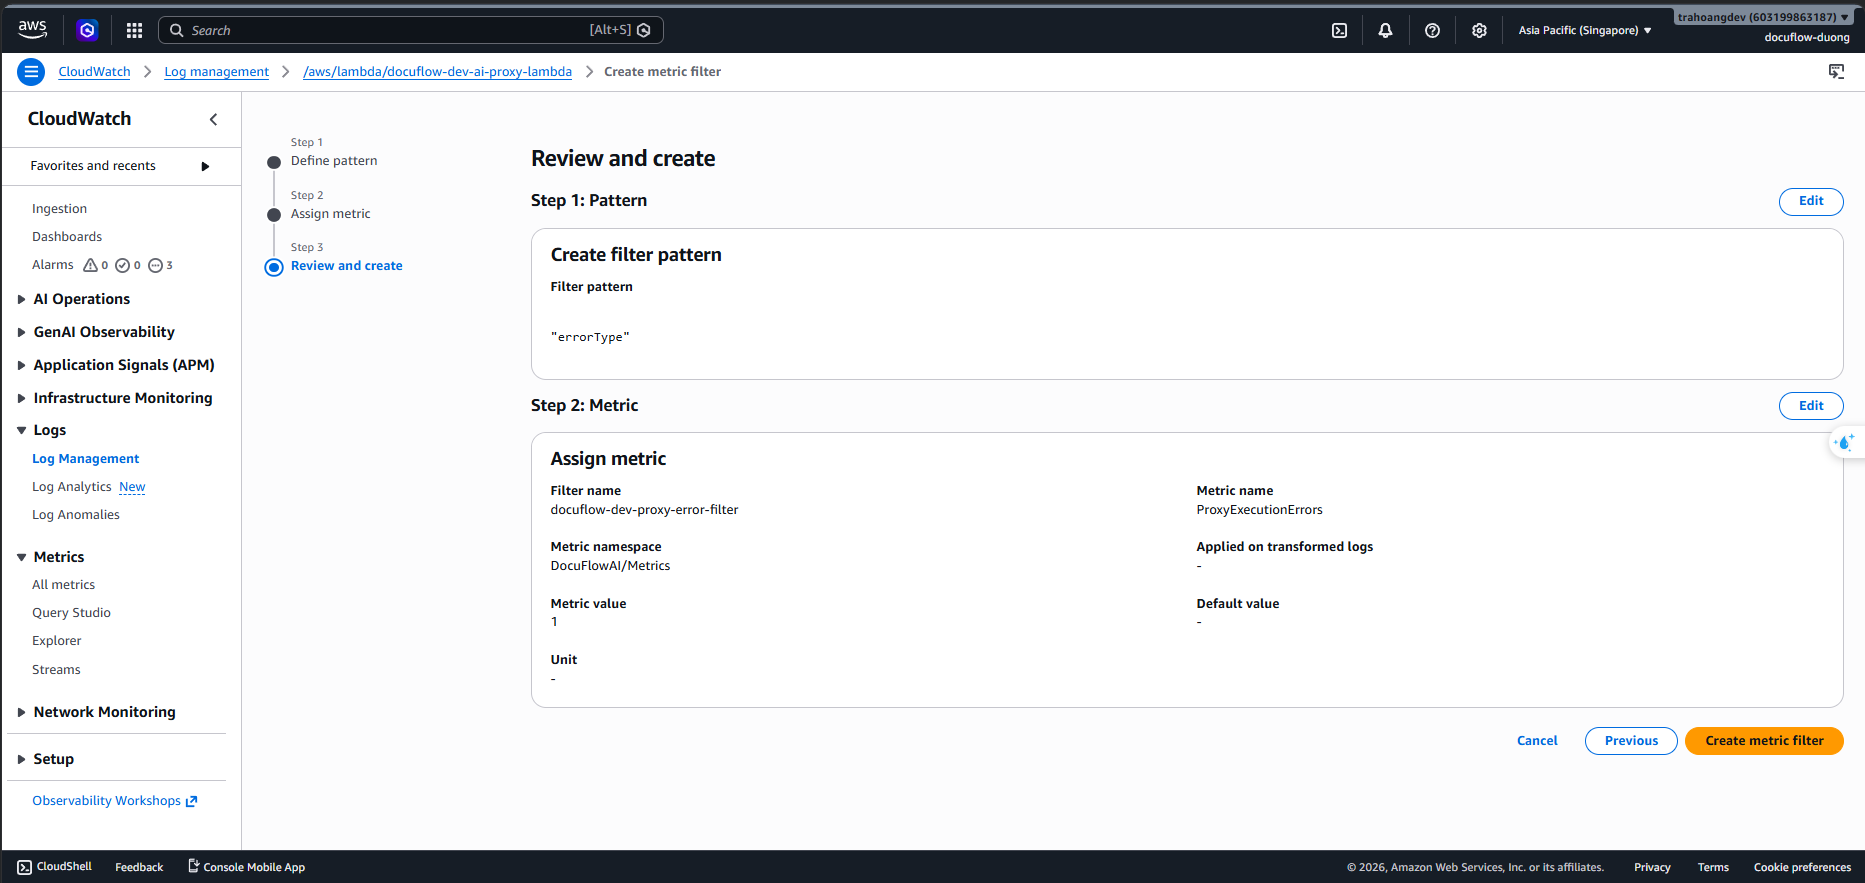
Step 1: Define pattern (Define search keyword):
- In the Filter pattern box, enter the exact string:
"errorType"(including the 2 quotes to correctly scan standard JSON error log structures). - You can click the Test pattern button to see if the current log contains this word. Then click Next.
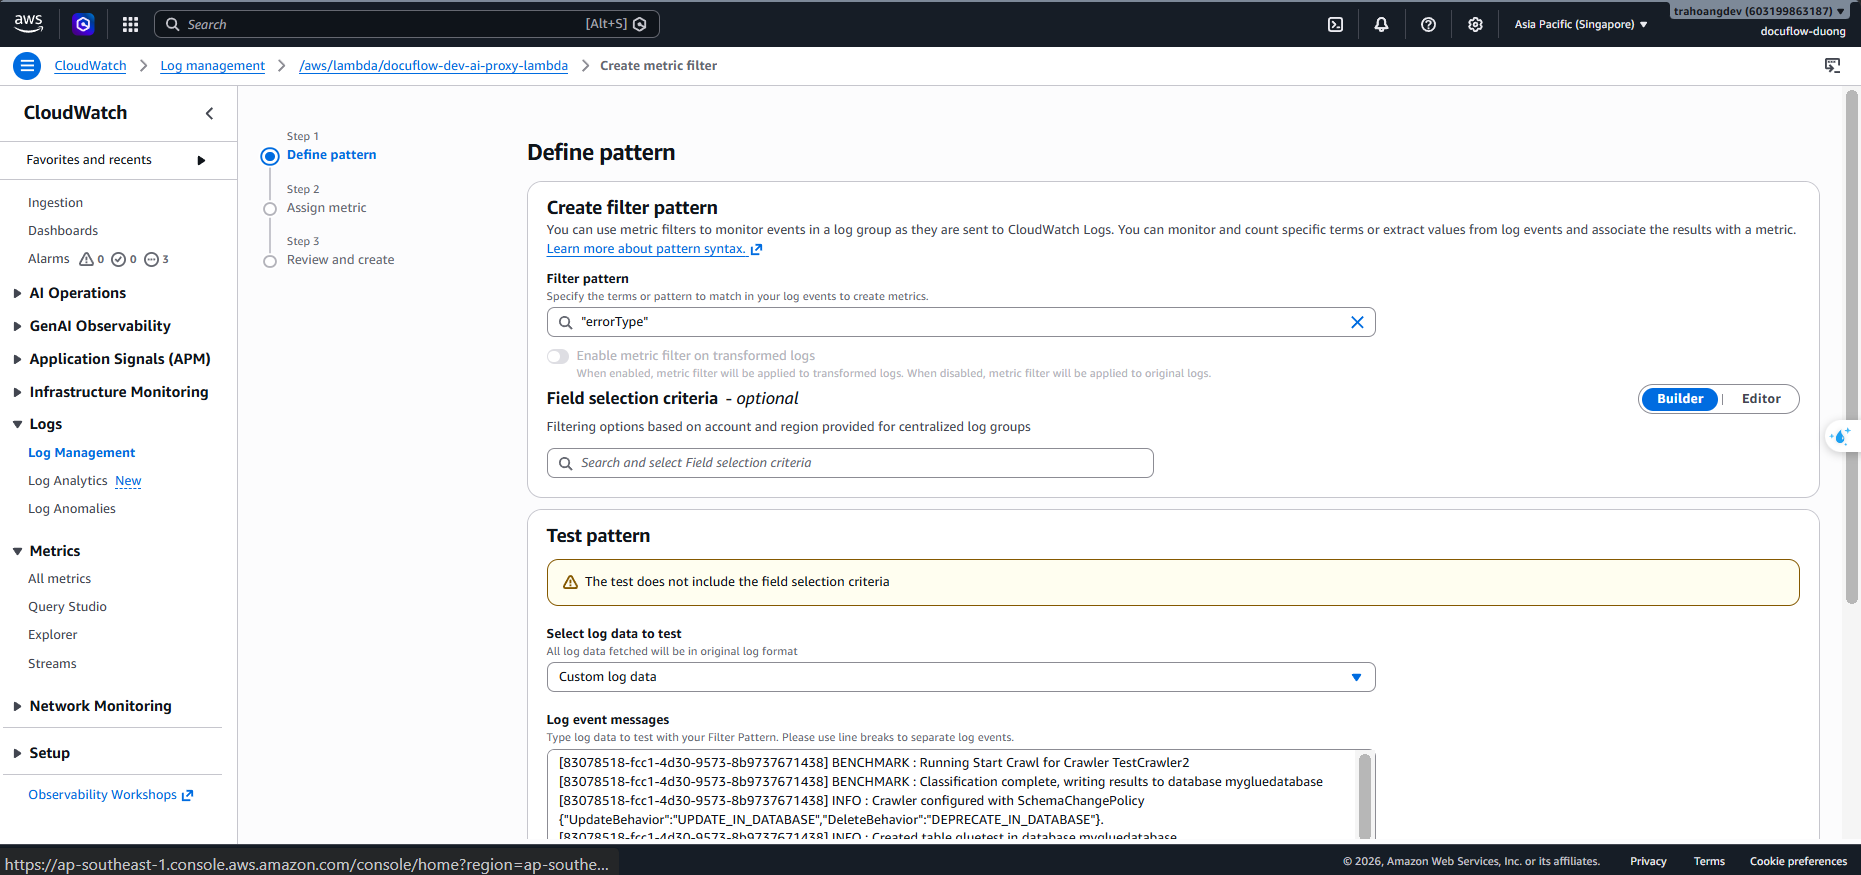
Step 2: Assign metric (Assign system metric):
- Filter name: Enter
docuflow-dev-proxy-error-filter - Metric namespace: Enter
DocuFlowAI/Metrics(Written together, this is the master box to contain all custom metrics of the project). - Metric name: Enter
ProxyExecutionErrors - Metric value: Enter the number
1(Meaning every time a log line appears with the word"errorType", the system automatically increments the count by 1). - Leave the remaining boxes blank. Click Next.
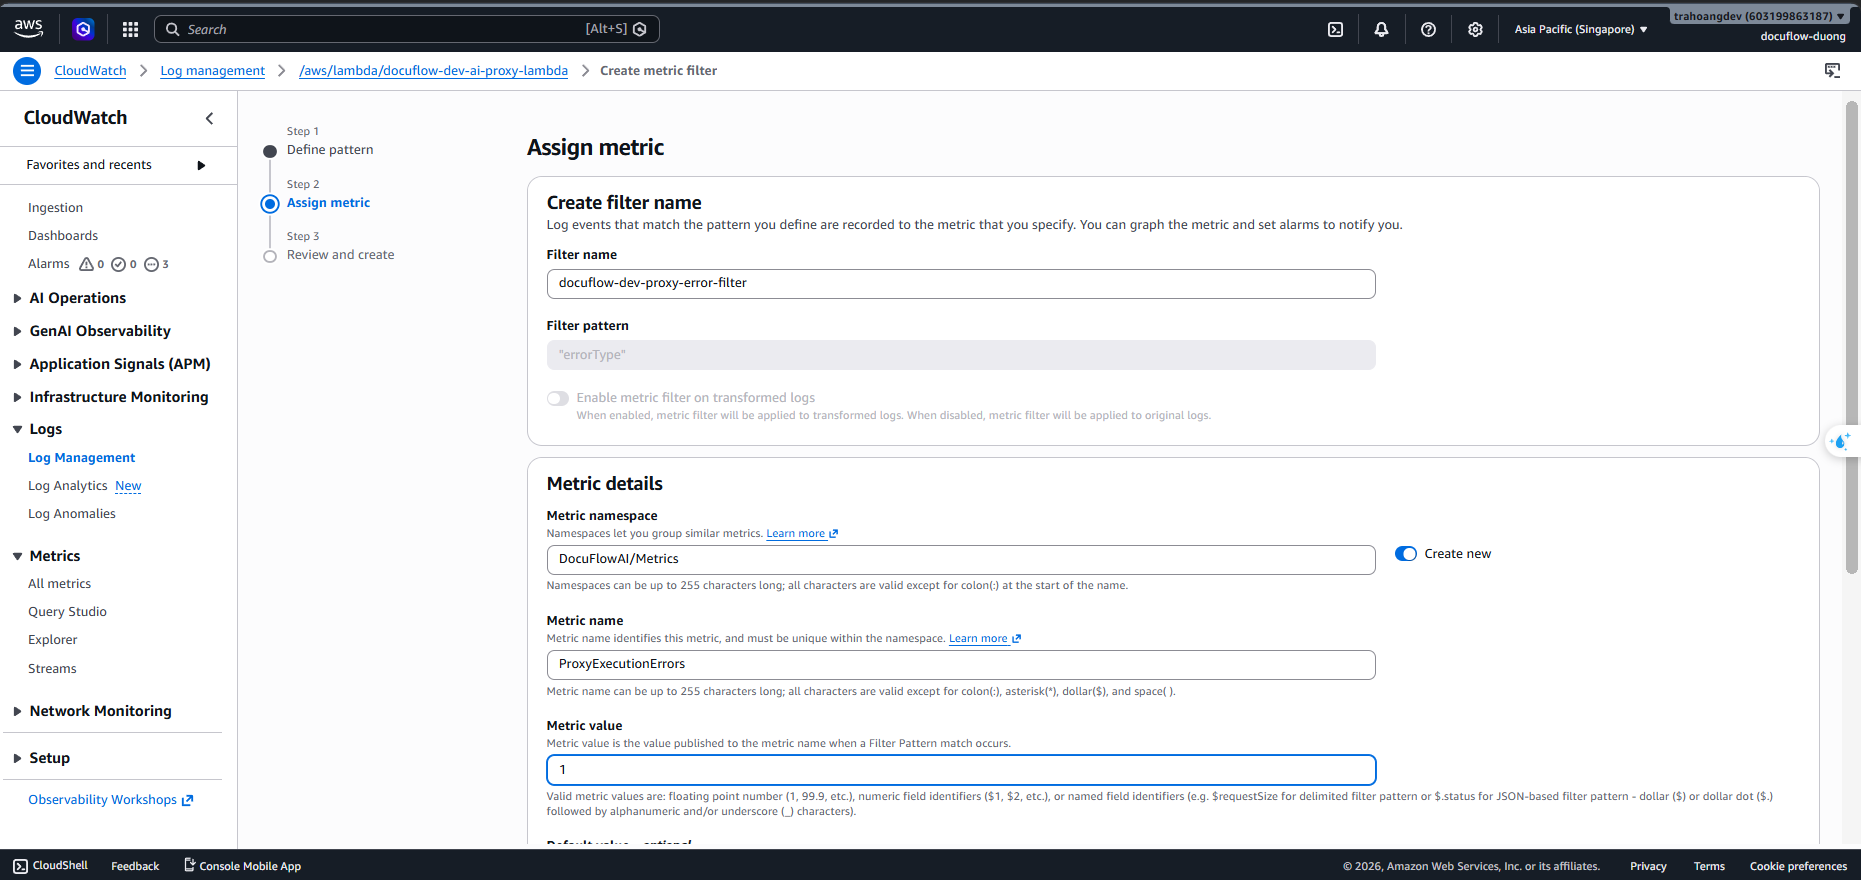
Step 3: Review and create:
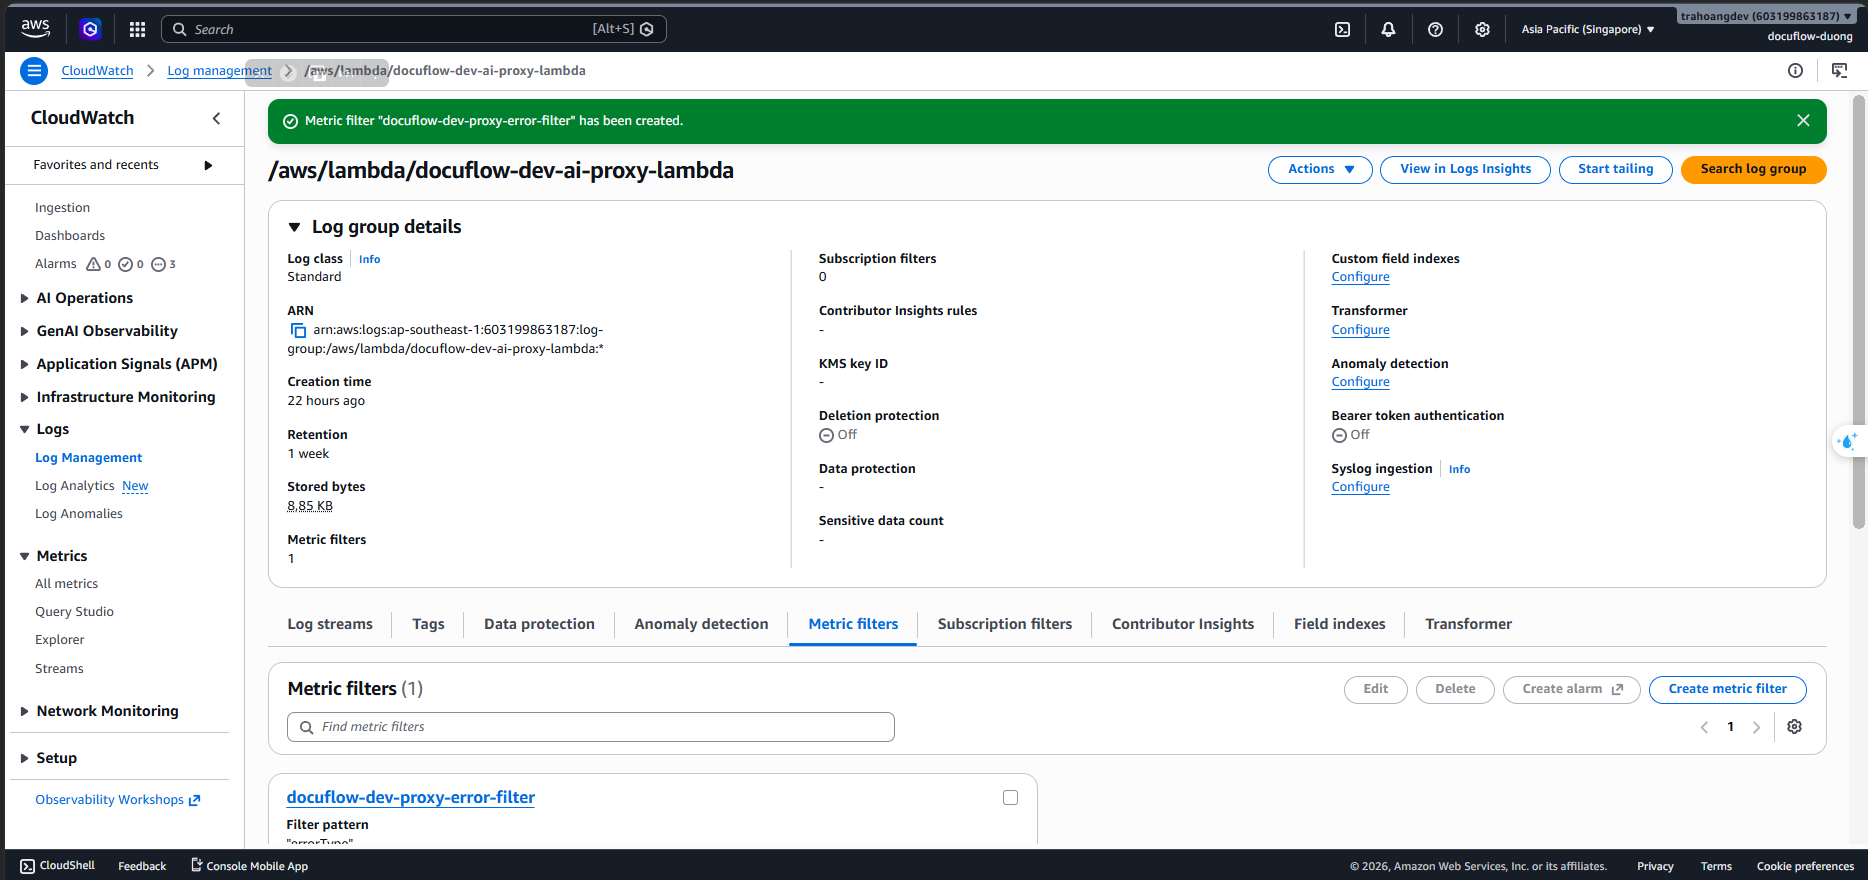
- Review once and then click Create metric filter.
Filter Set 2: Monitor the number of invoices requiring manual review REVIEW_REQUIRED (Configured on Tra’s function)
This filter helps count how many invoices have a low confidence score and need human intervention to review.
- Return to the Log groups list, click on the group name:
/aws/lambda/docuflow-dev-ai-confidence-status-lambda. - Select the Metric filters tab ➔ Click the Create metric filter button.
Step 1: Define pattern:
- In the Filter pattern box, enter the exact string:
"REVIEW_REQUIRED". Click Next.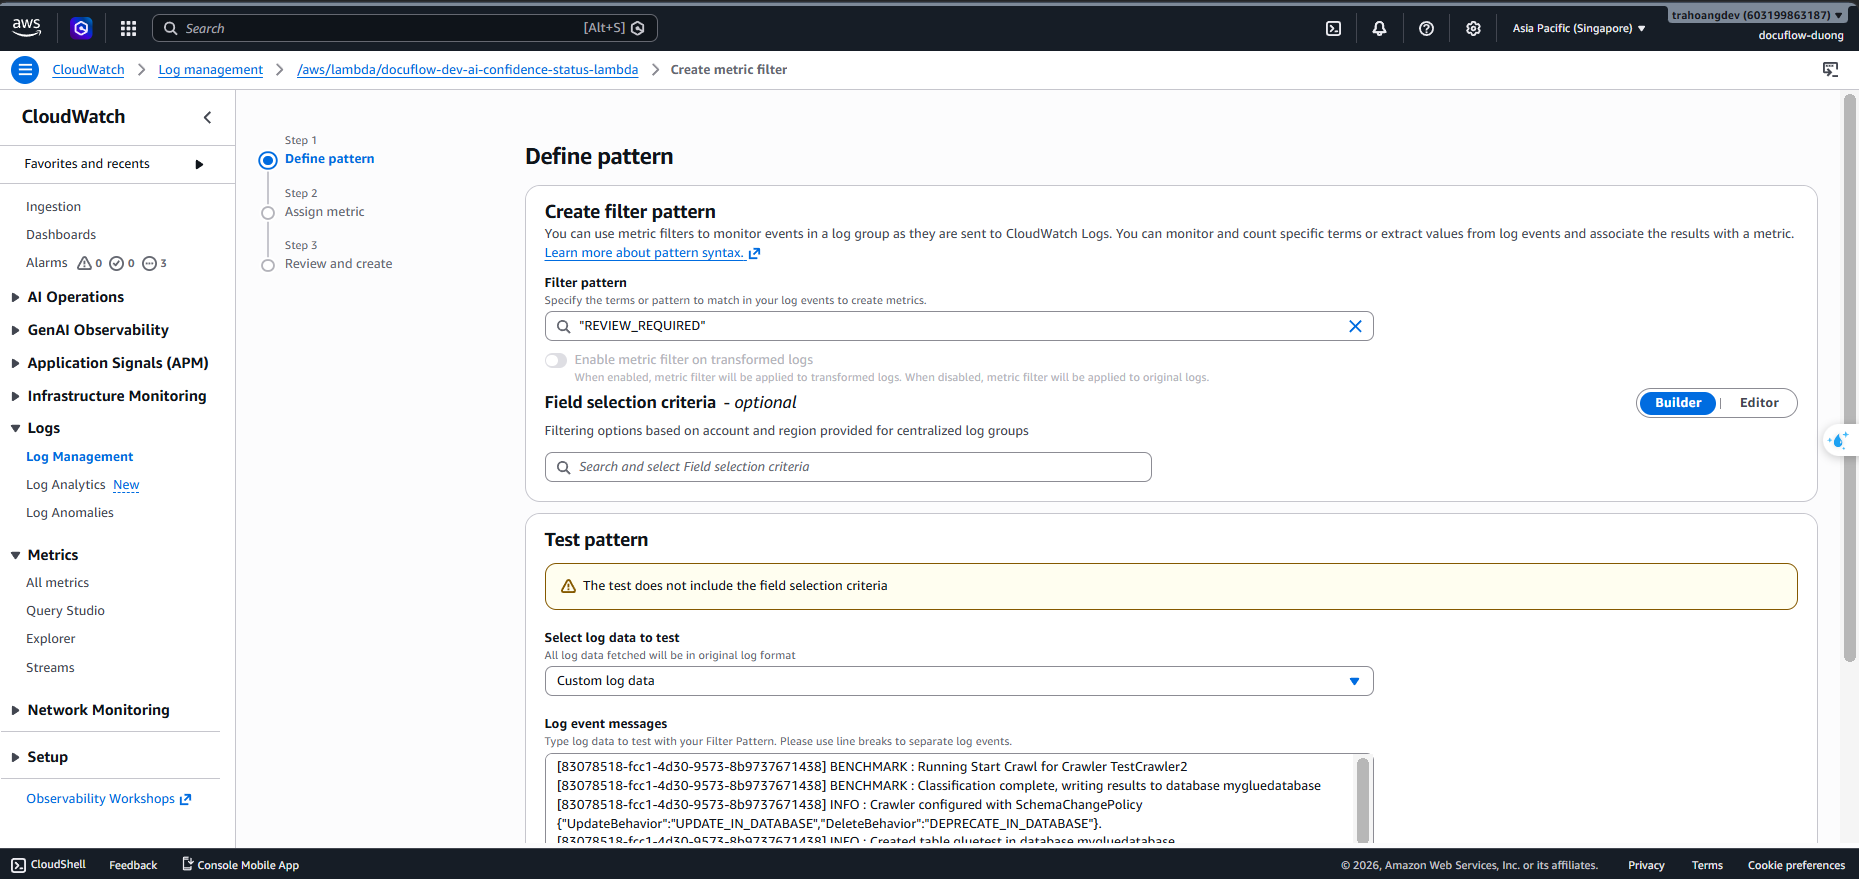
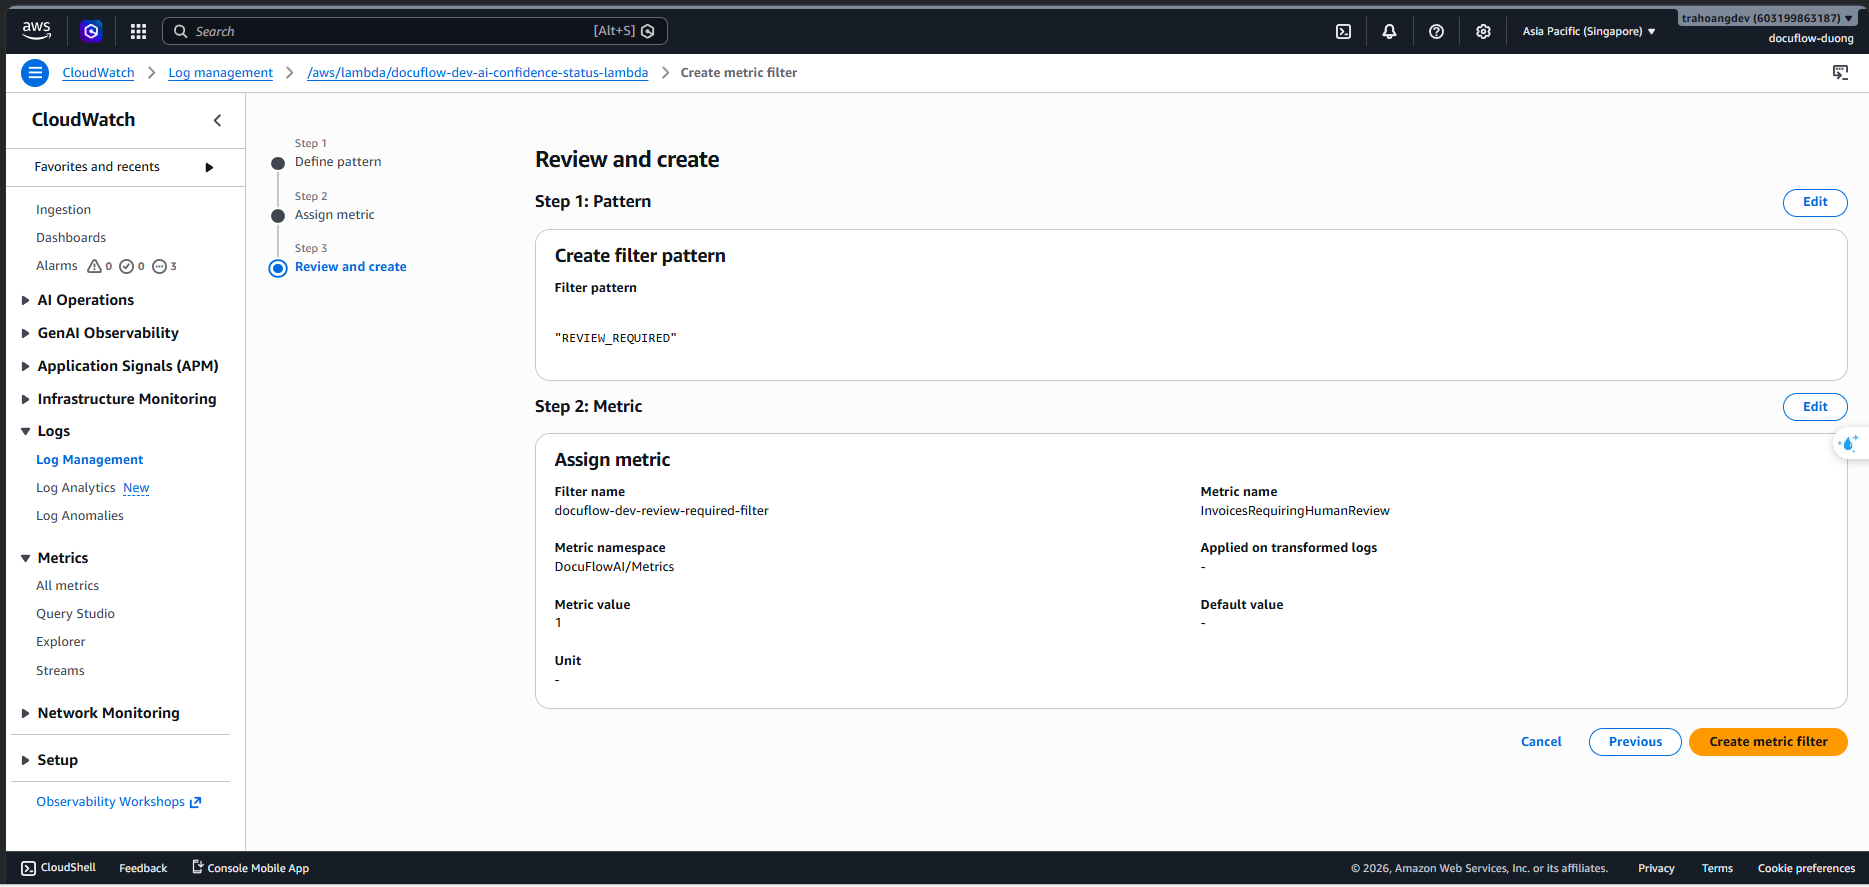
Step 2: Assign metric:
- Filter name: Enter
docuflow-dev-review-required-filter - Metric namespace: Enter exactly the same as above to group:
DocuFlowAI/Metrics - Metric name: Enter
InvoicesRequiringHumanReview - Metric value: Enter the number
1. Click Next.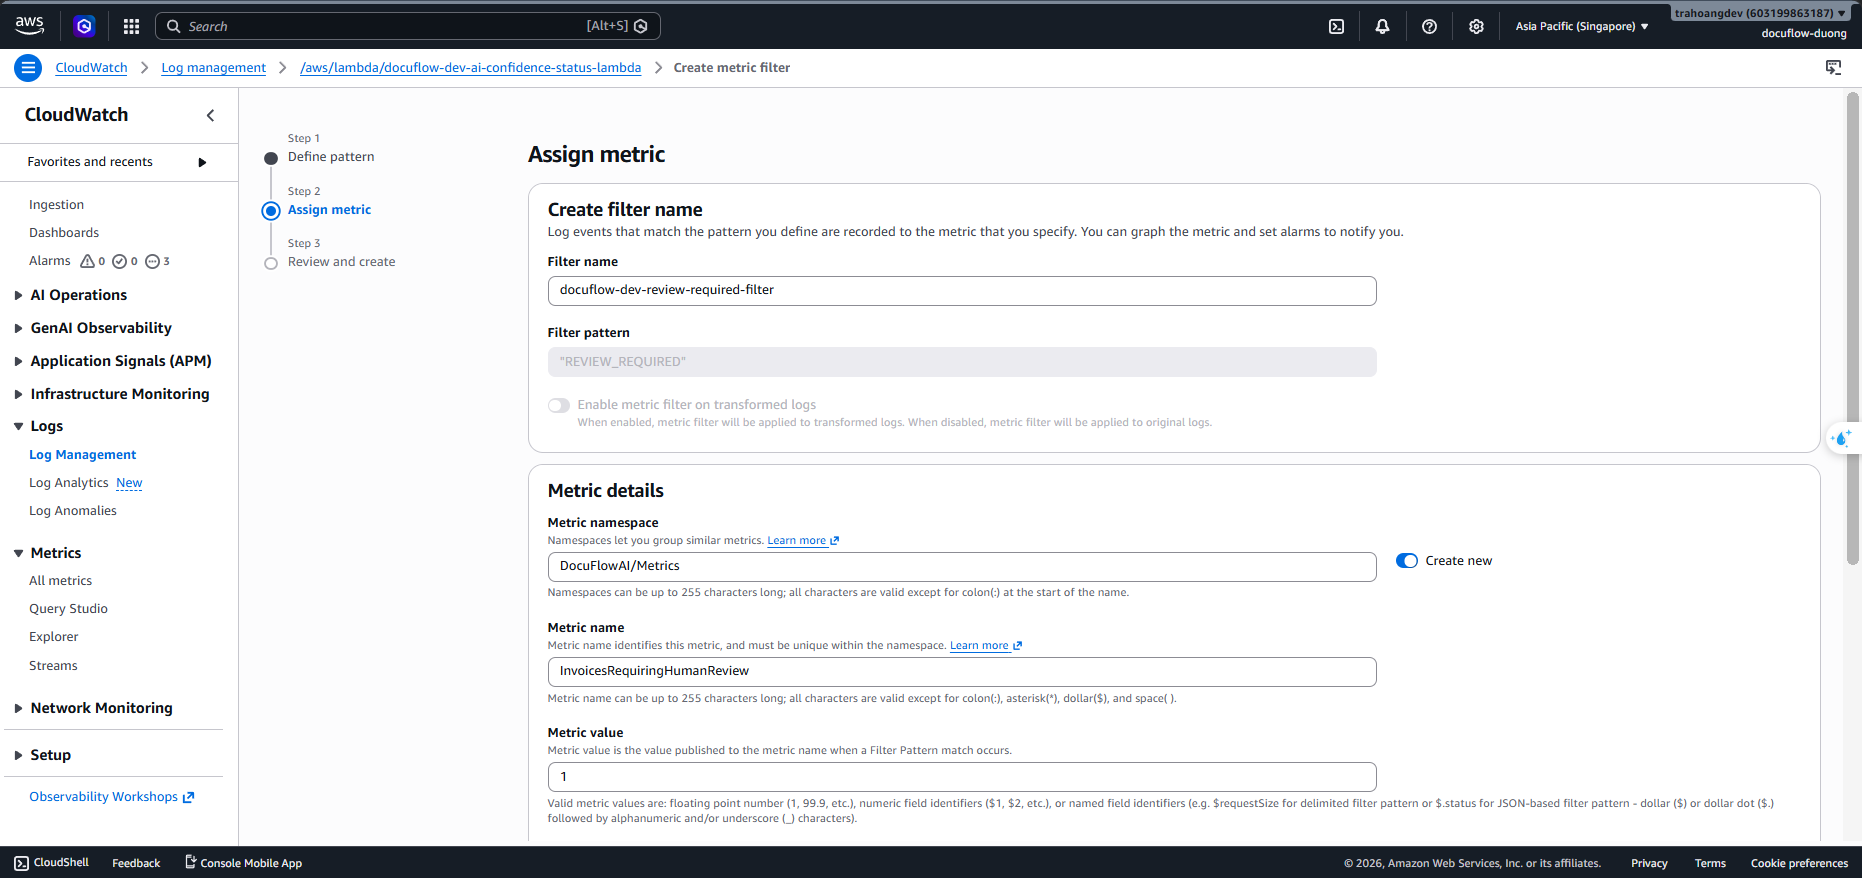
Step 3: Review and create:
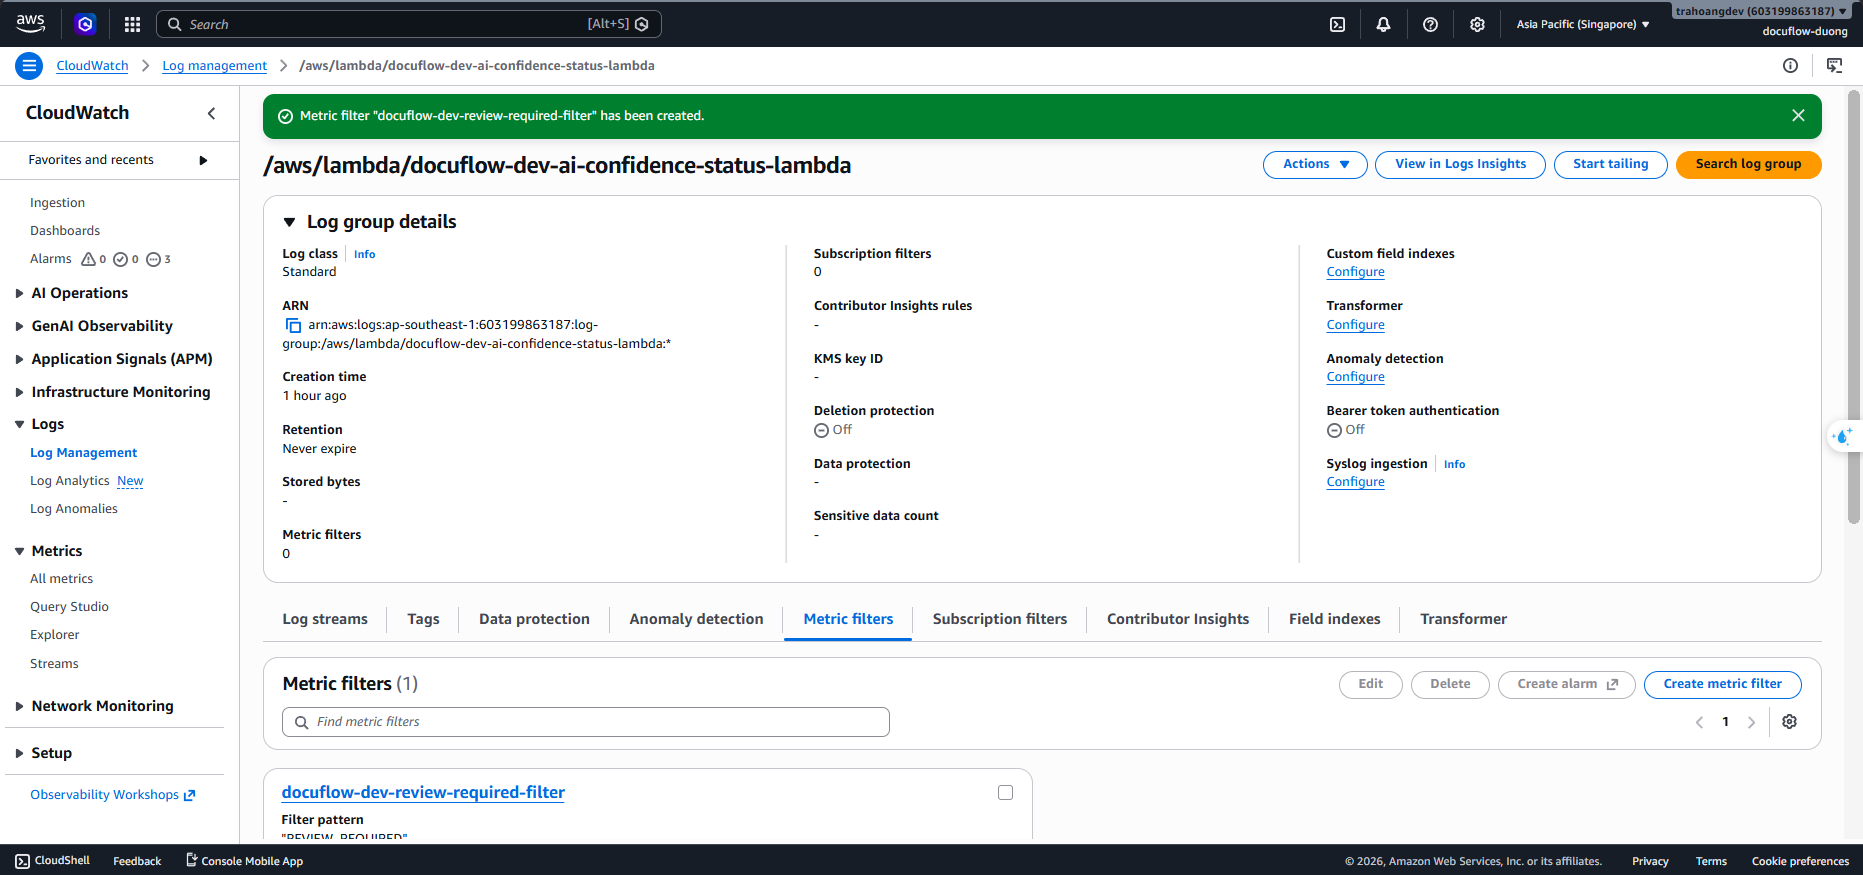
Click Create metric filter to finish.