Distributed Tracing
To monitor detailed performance and draw the path of requests (Service Map) throughout the system—from the API Gateway, through the Step Functions state machine, down to each executing Lambda function—we need to enable AWS X-Ray.
Step 1: Enable X-Ray on API Gateway Stage
API Gateway acts as the entry point, generating the initial Trace ID to pass along the processing flow.
Go to the API Gateway service on the AWS Console.
Click on the project’s API name:
docuflow-dev-api.On the left vertical menu, select Stages.
Click on the name of the running stage (For example:
devorv1).Switch to the Logs/Tracing tab on the right interface panel.
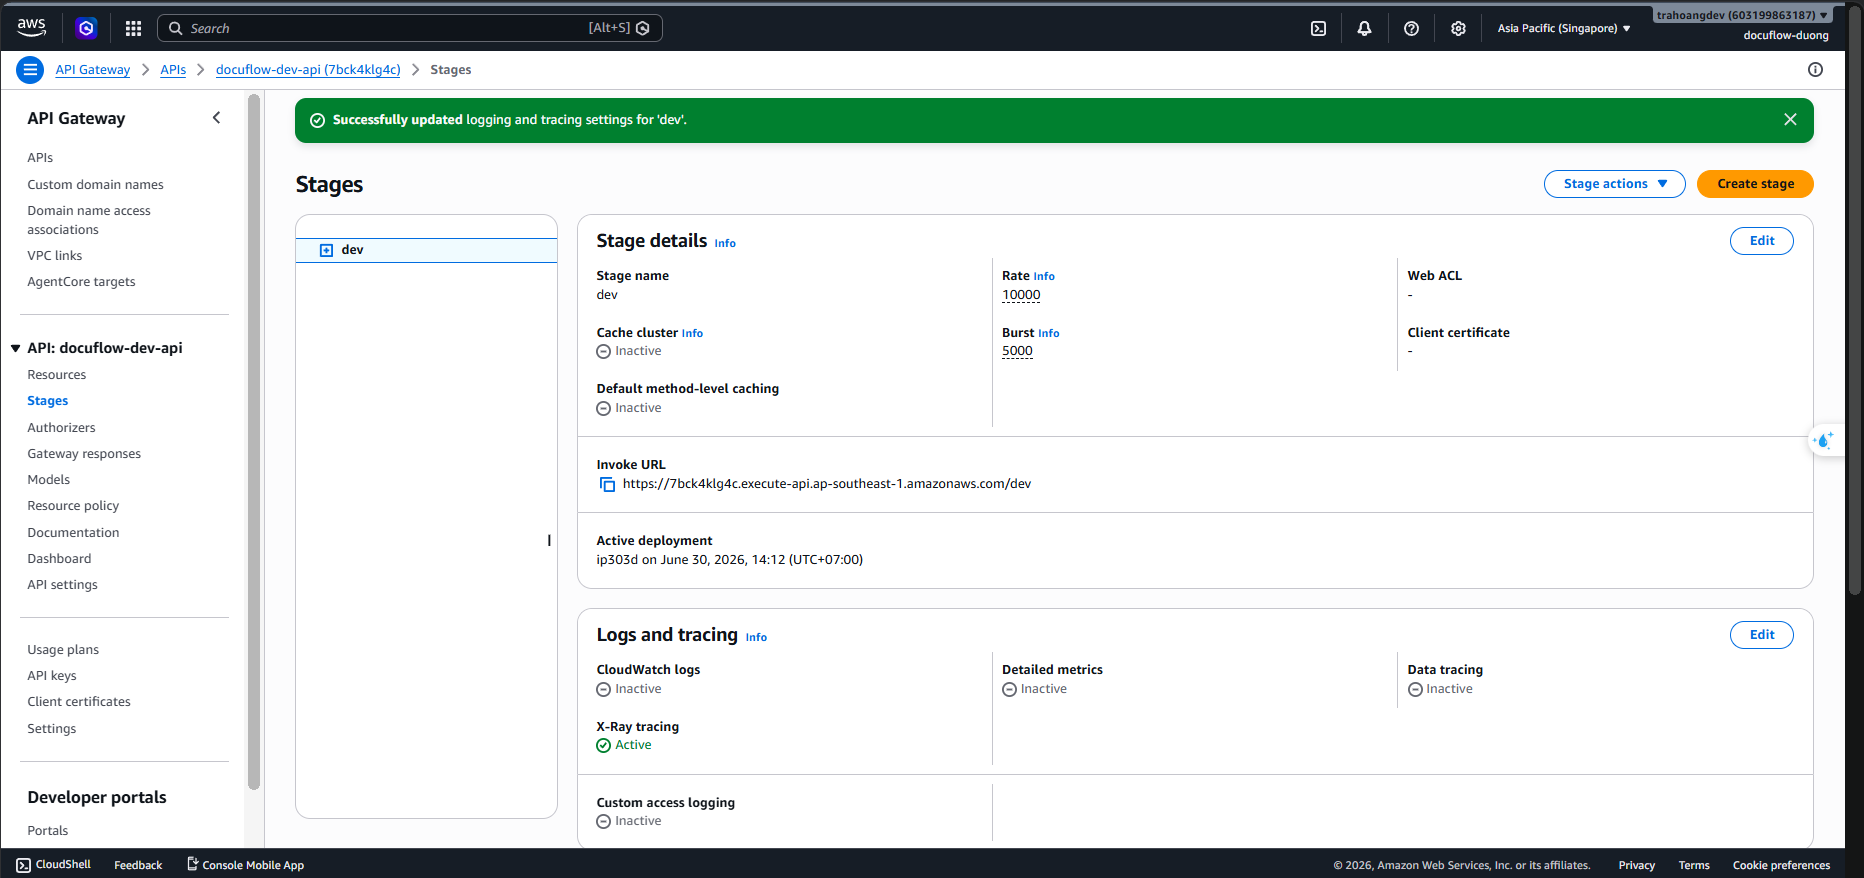
Find the X-Ray Tracing section ➔ Check the Enable X-Ray Tracing box.
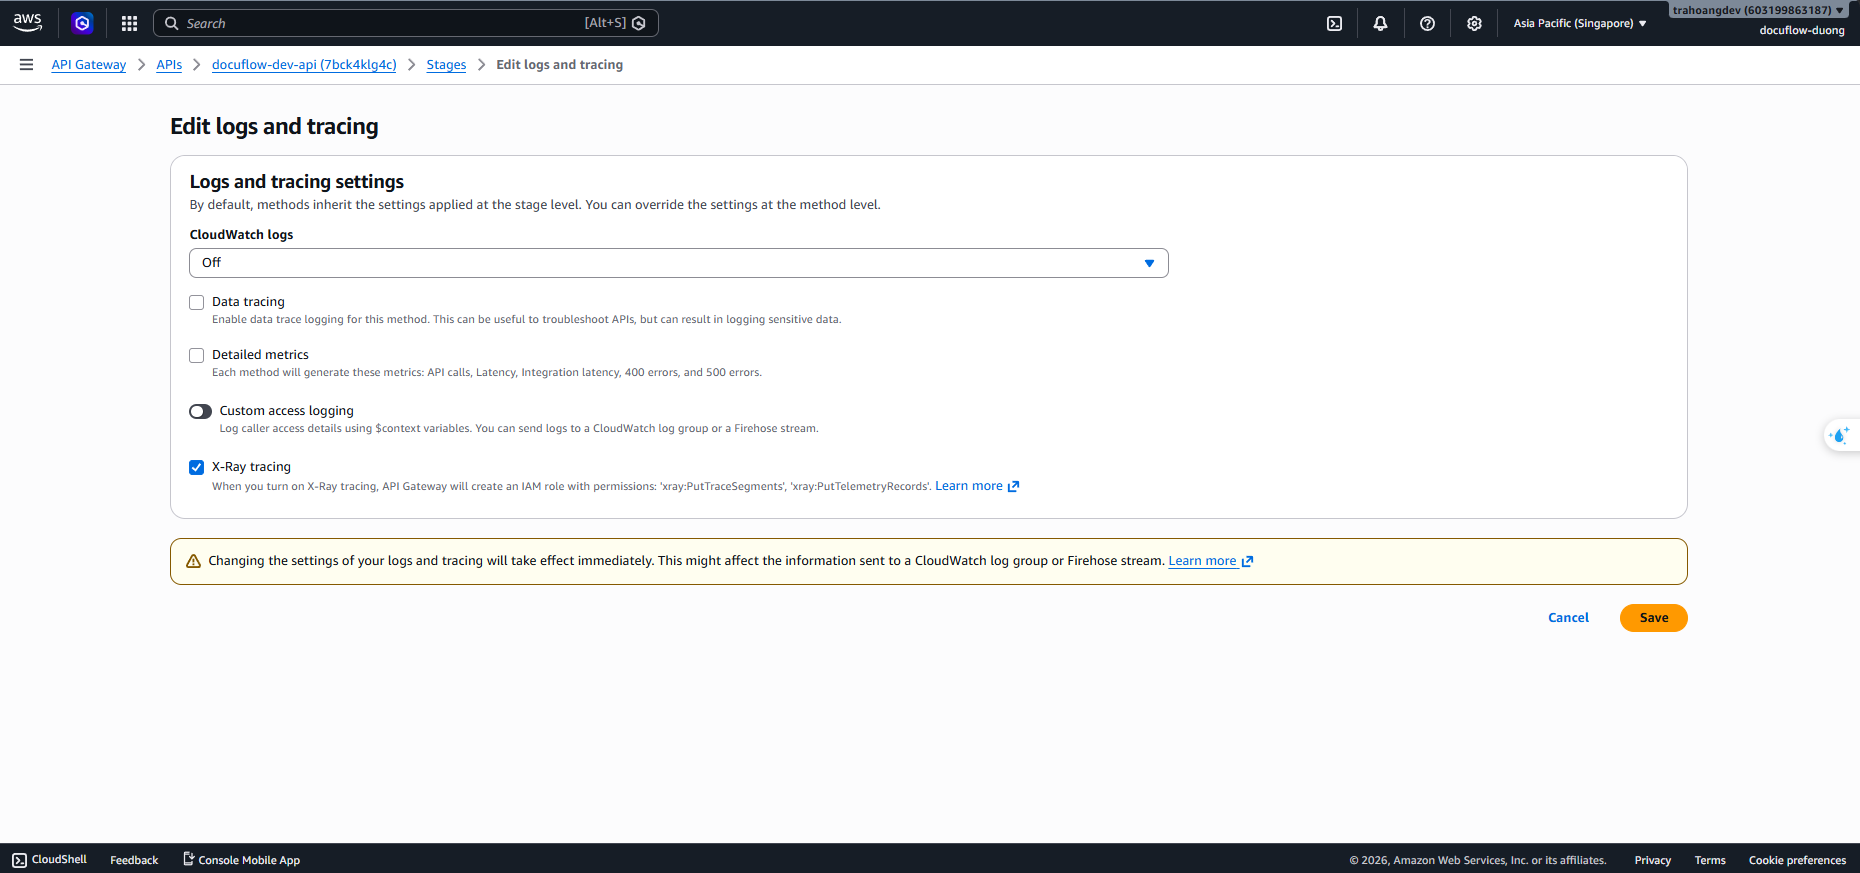
Click the Save changes button at the bottom to save the configuration.
Step 2: Enable X-Ray on Step Functions (Workflow)
Helps the state machine inherit the Trace ID from API Gateway and forward it to Lambda tasks.
Go to the Step Functions service on the AWS Console.
Select the project’s State Machine:
docuflow-dev-workflow-processing-state-machine.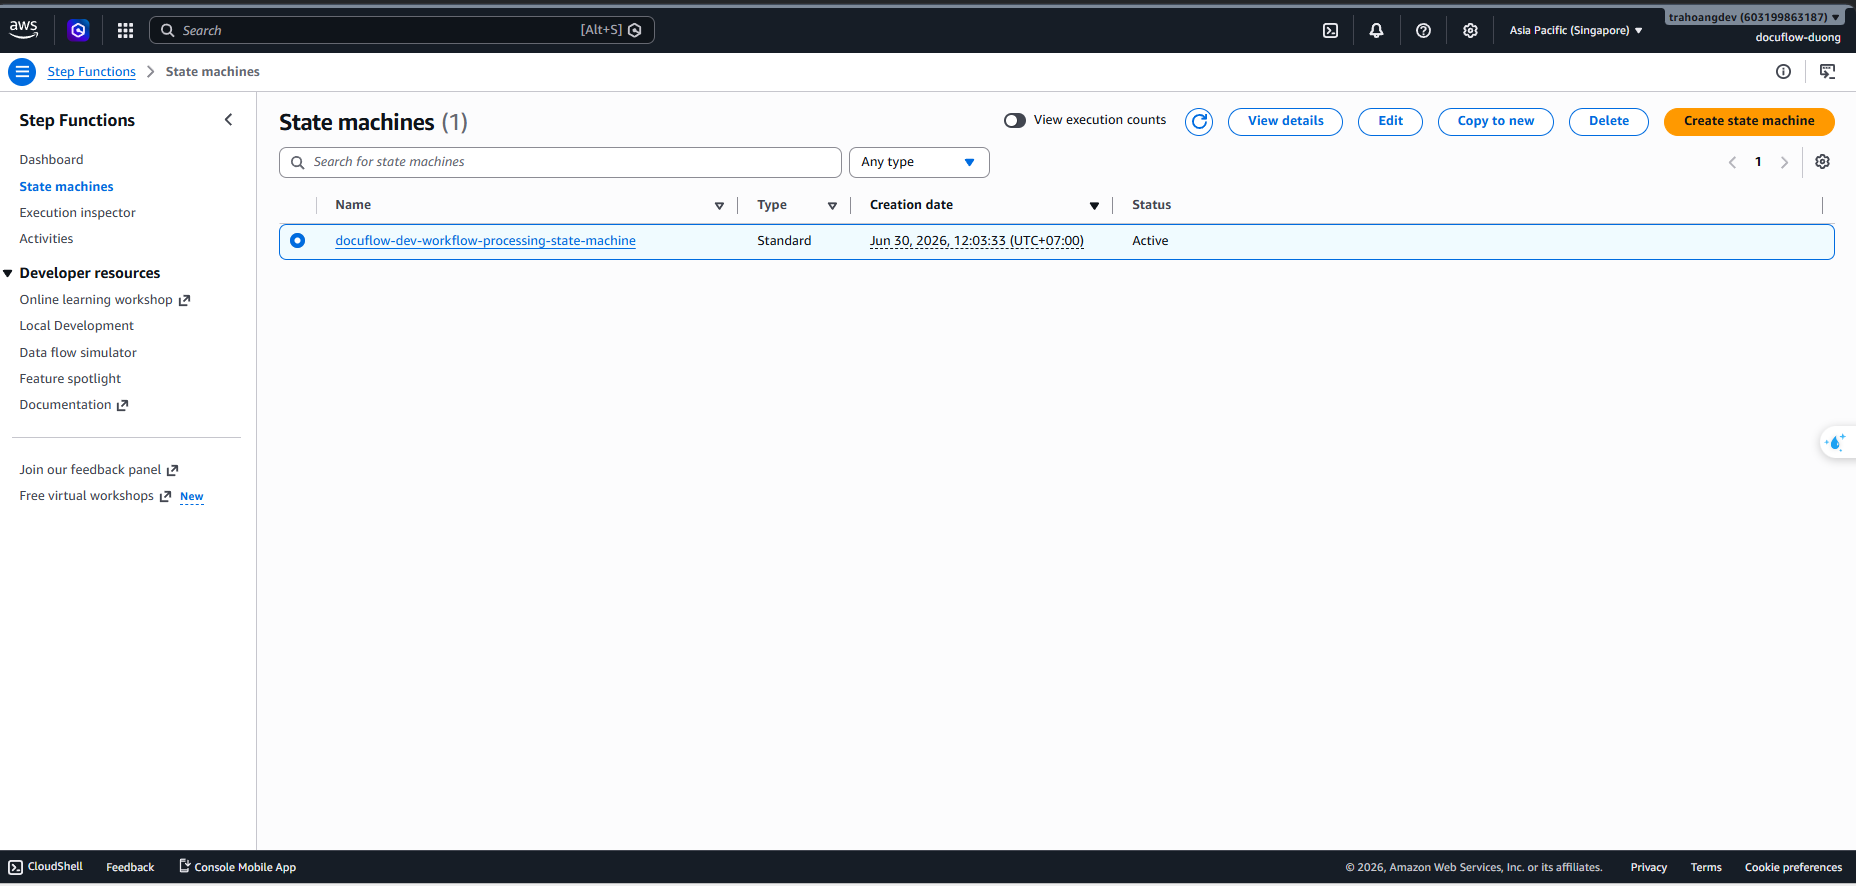
In the top right corner, click the Edit button.
Scroll down to the bottom of the configuration page and find the Tracing (or Additional configuration) section.
Check the Enable X-Ray tracing box.
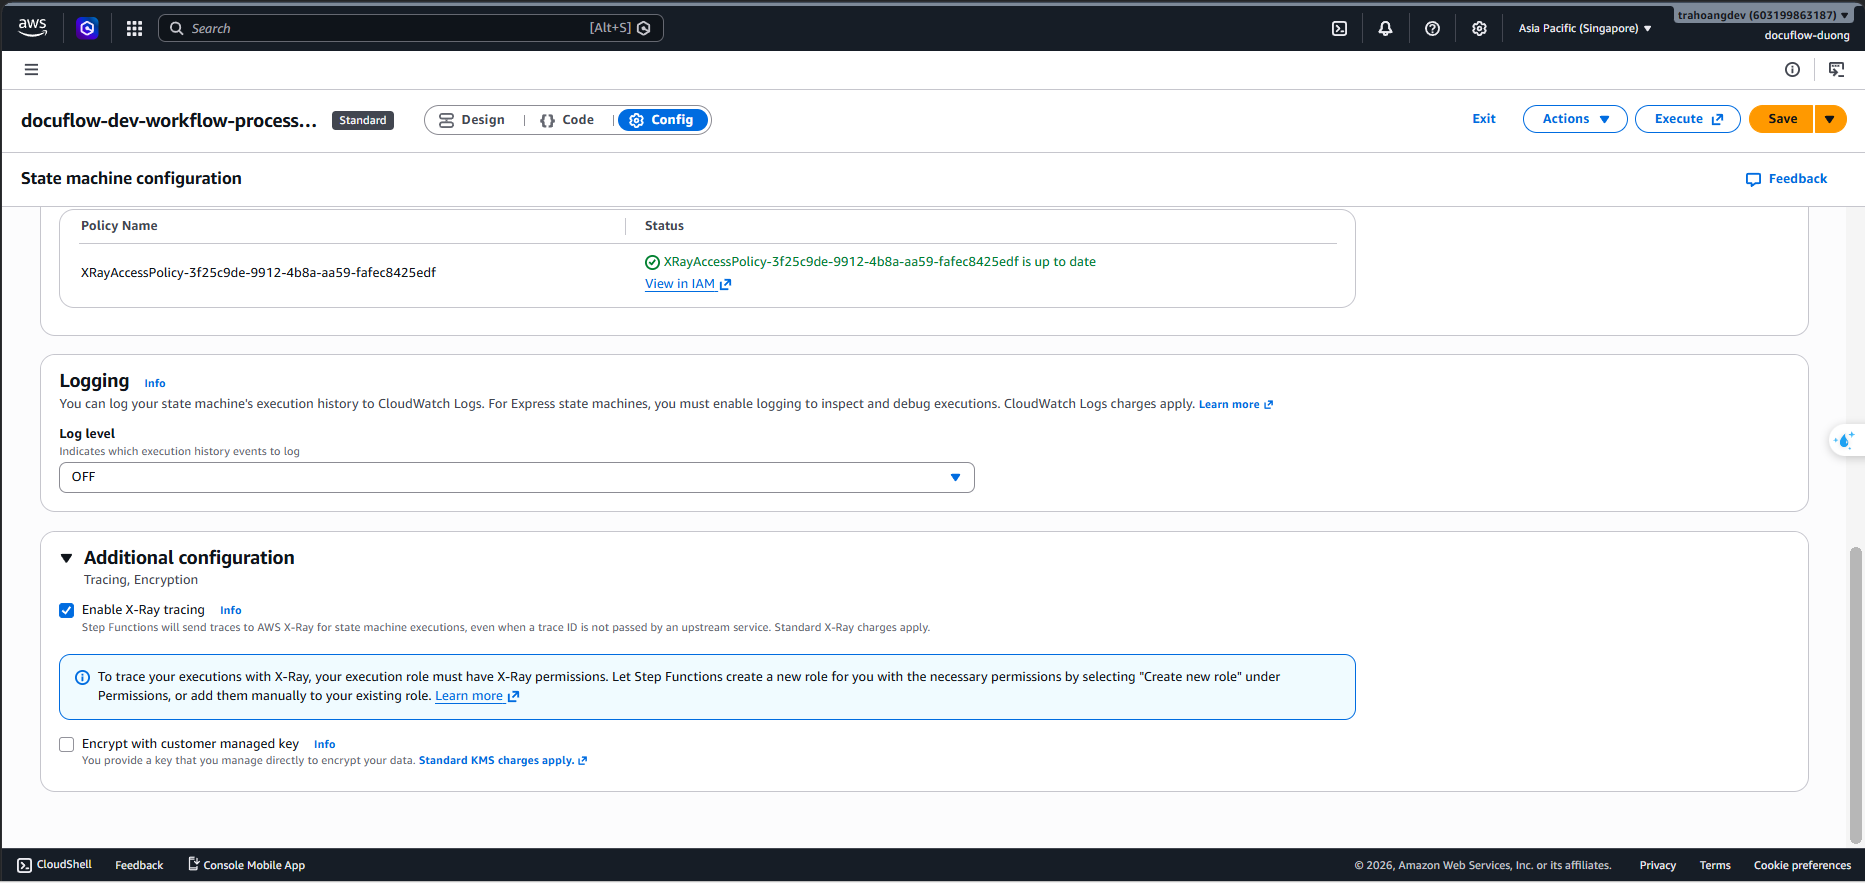
Click the Save button in the top right corner to update.
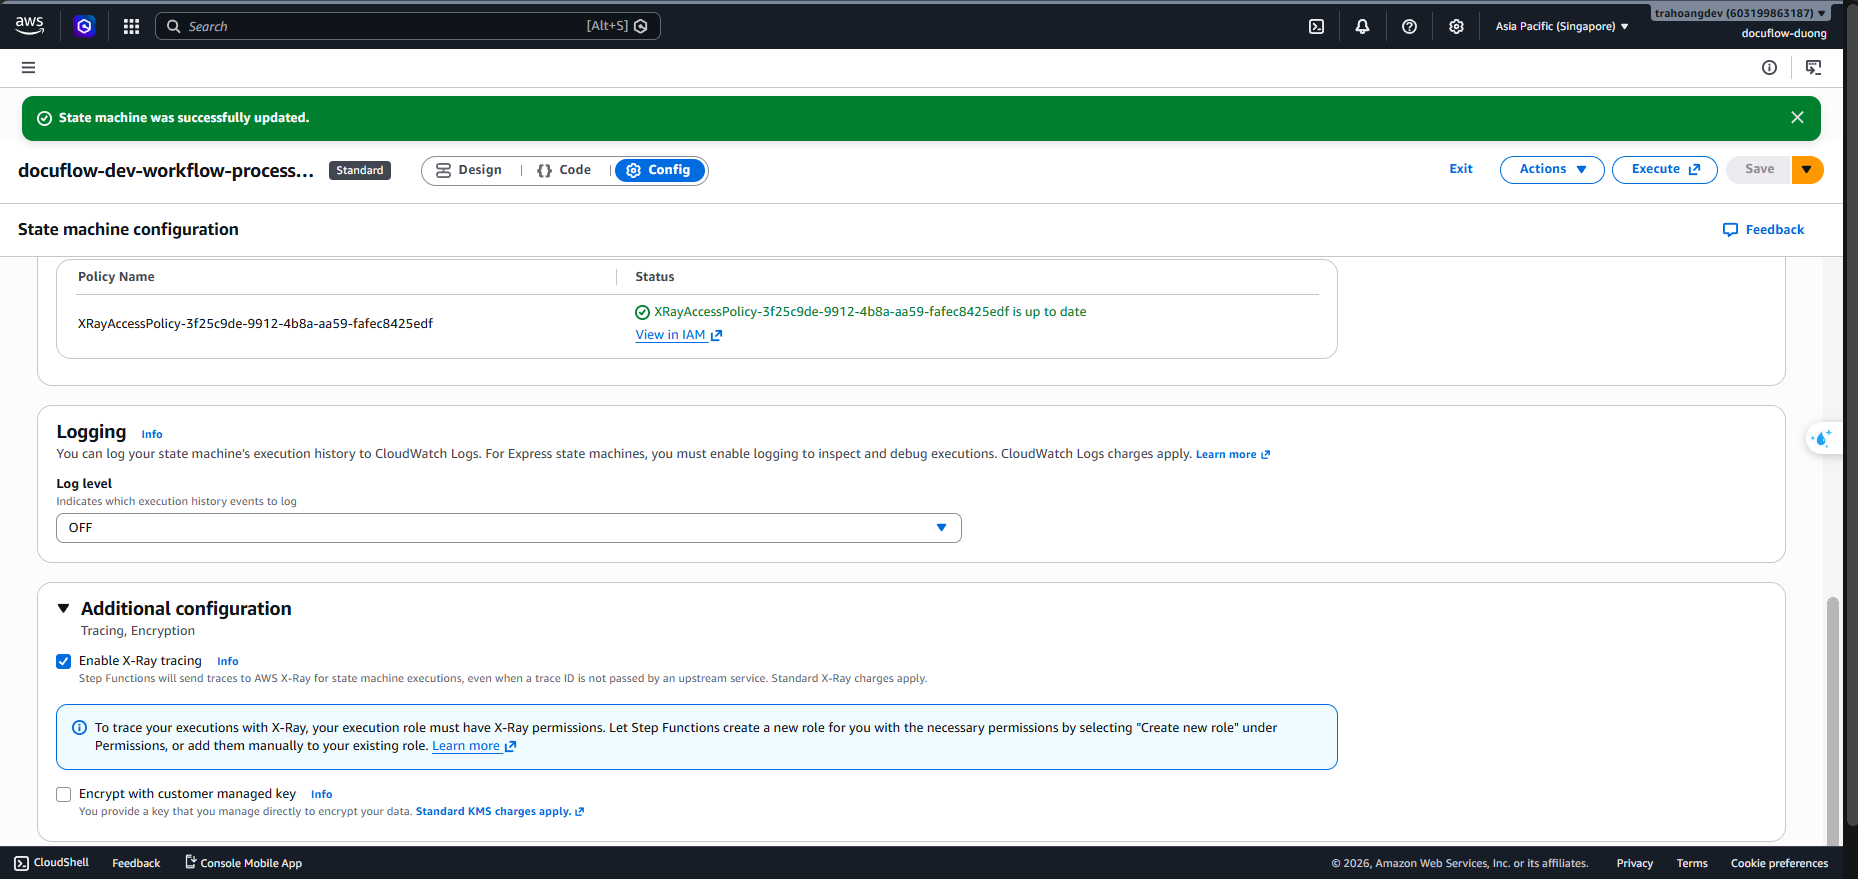
Step 3: Enable X-Ray on 8 core Lambda functions
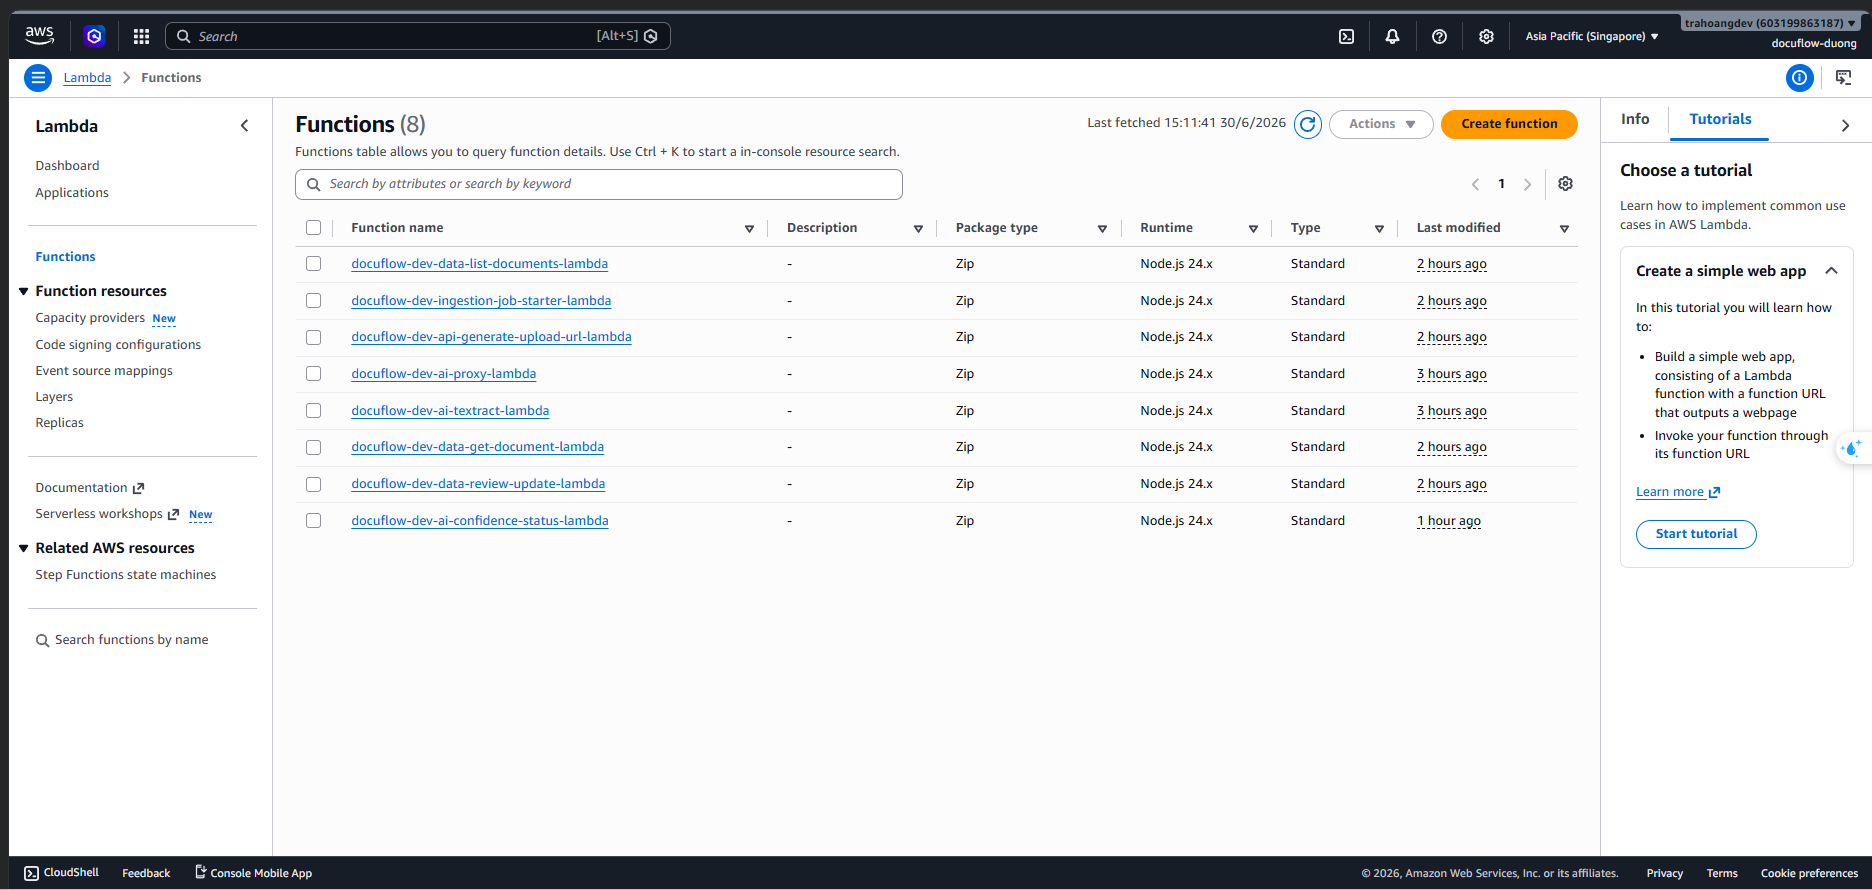
You need to manually enable Active Tracing for each Lambda function so X-Ray can record detailed code execution logs:
List of 8 Lambda functions to go through:
docuflow-dev-api-generate-upload-url-lambdadocuflow-dev-ingestion-job-starter-lambdadocuflow-dev-workflow-validate-lambdadocuflow-dev-ai-textract-lambdadocuflow-dev-ai-proxy-lambdadocuflow-dev-ai-confidence-status-lambdadocuflow-dev-data-get-document-lambdadocuflow-dev-data-list-documents-lambda
Steps to perform on each function:
Click on the name of the first Lambda function in the list.
Select the Configuration tab (next to the Code tab).
Look at the left vertical menu in the tab and select Monitoring and tools.
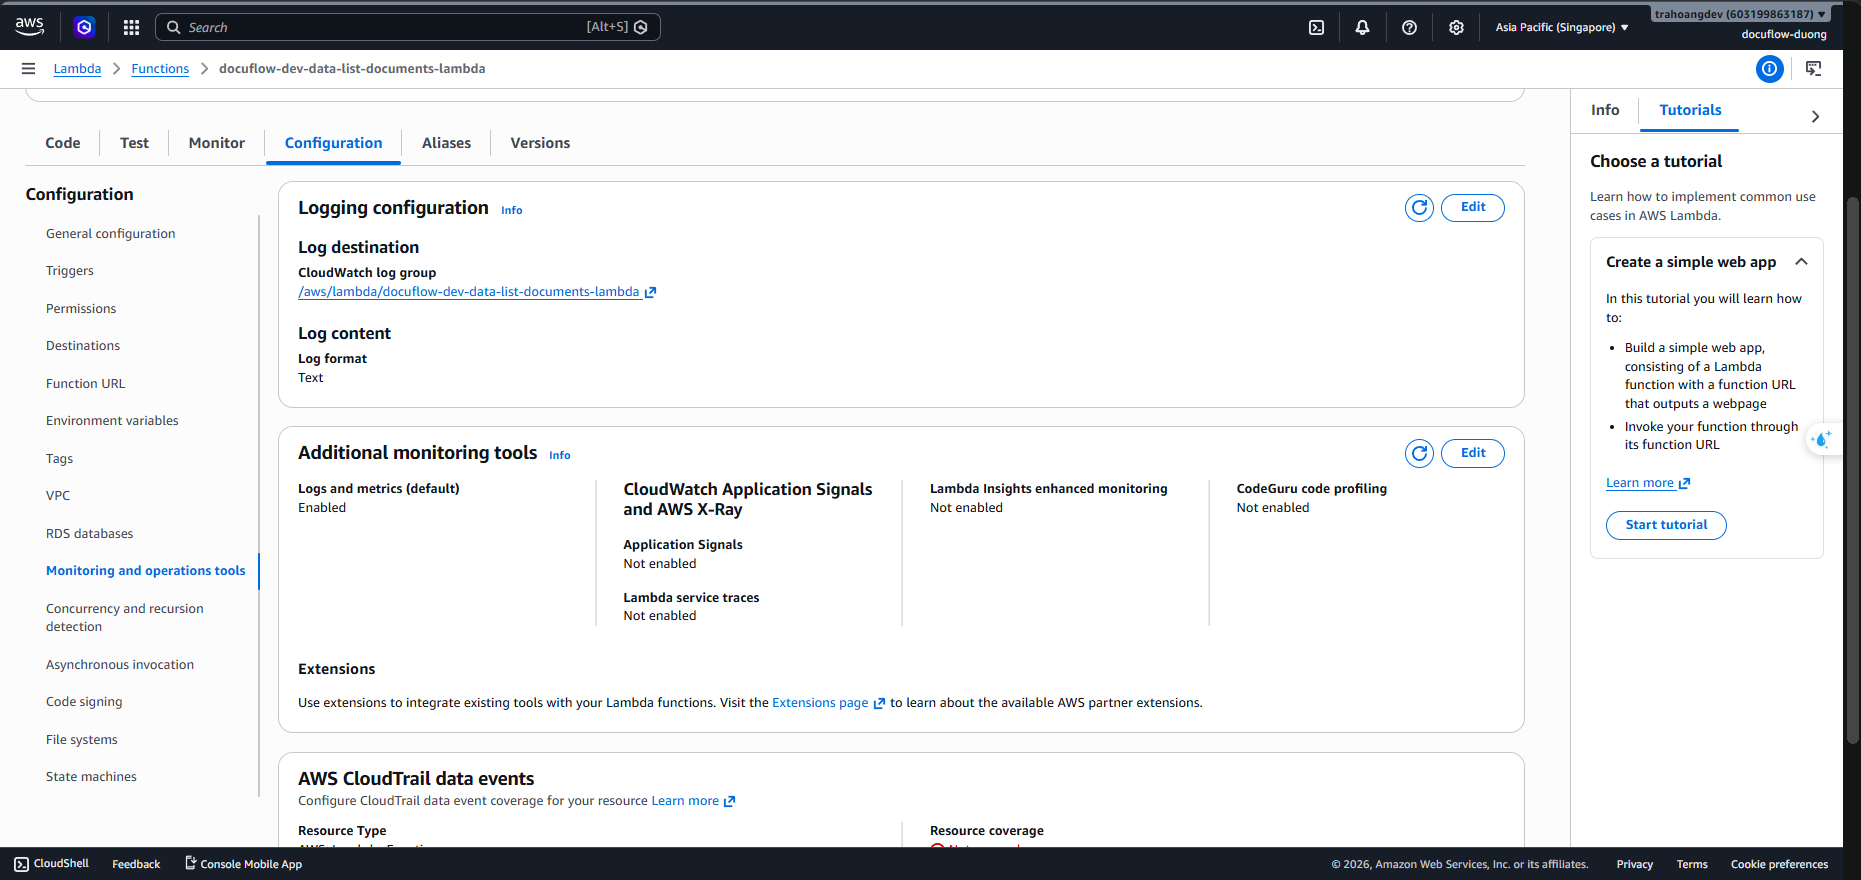
In the top right corner of the content panel, click the Edit button.
Scroll down to find the Lambda service traces line ➔ Check Enable.
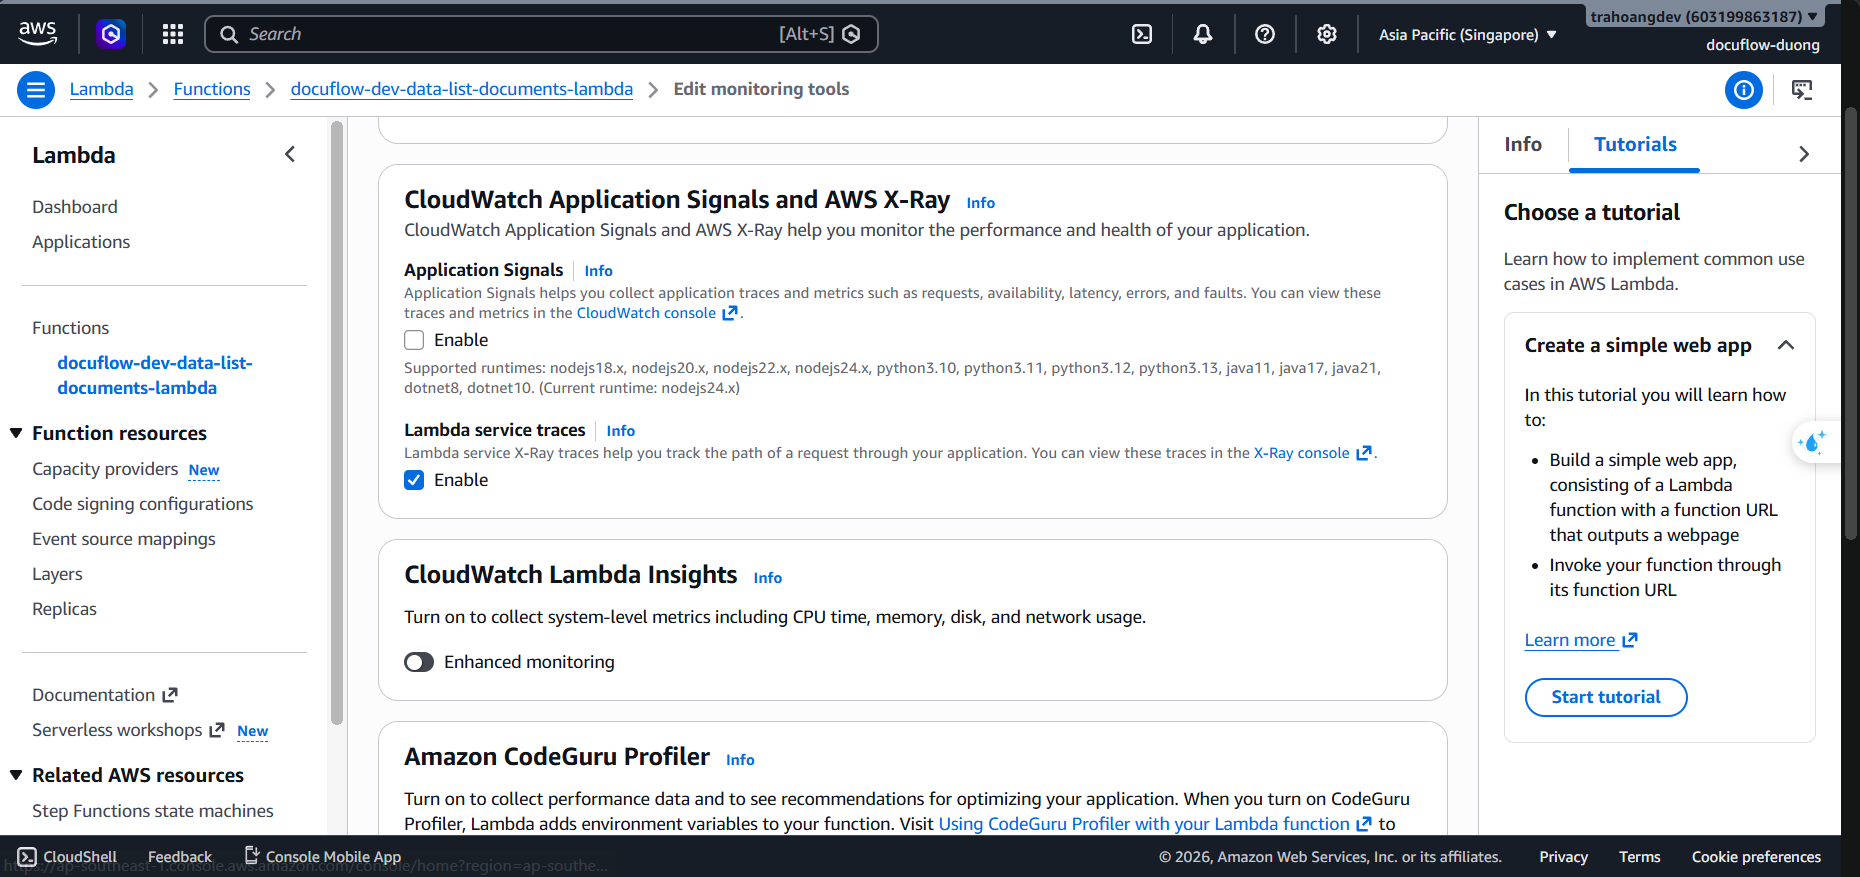
Click the orange Save button at the bottom to apply.
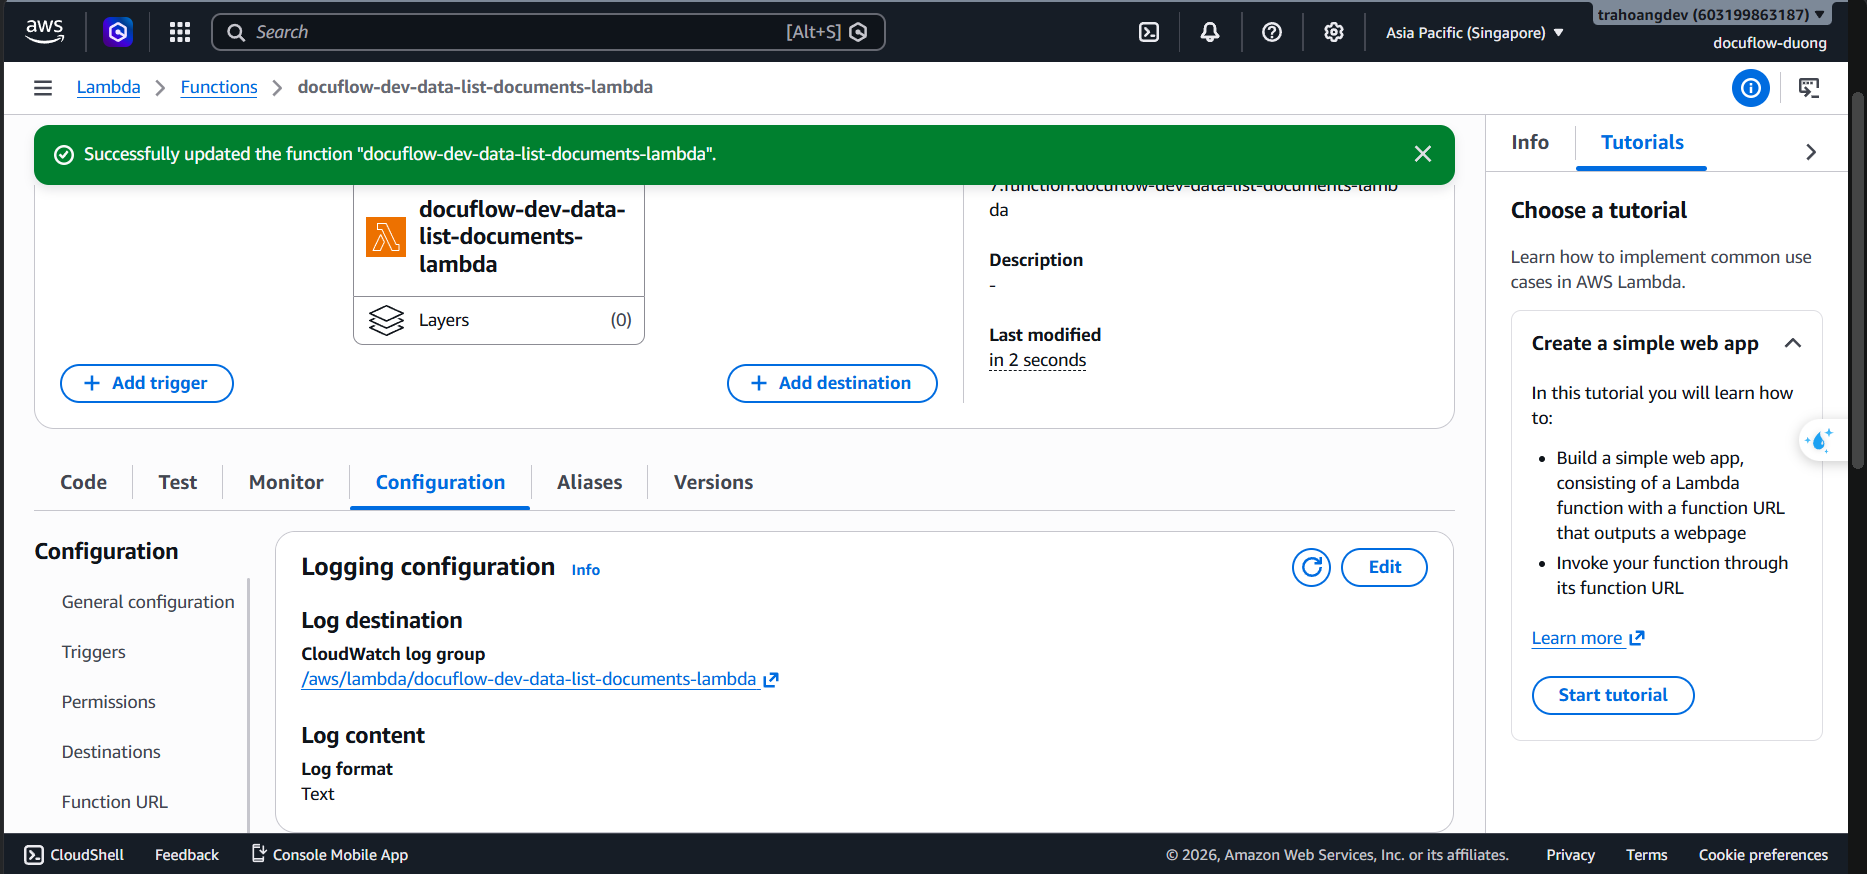
Do the same for the remaining 7 Lambda functions, one by one.
Step 4: Fix IAM Role permissions (Extremely important)
When Active Tracing is enabled for Lambda, the Lambda code must have permission to send trace telemetry data back to the CloudWatch X-Ray daemon. If permissions are missing, the processing flow might be interrupted:
- Go to the IAM service ➔ Select the Roles section.
- Find and click on each execution Role of the project (For example:
docuflow-dev-data-lambda-role,docuflow-dev-security-ai-proxy-role,…). - For each role, click Add permissions ➔ Select Attach policies.
- Search for the default AWS policy:
AWSXRayDaemonWriteAccess. - Check it and click Attach policy to complete granting permissions.
Step 5: How to check the X-Ray Service Map
- Go to the CloudWatch service ➔ On the left menu select X-Ray traces ➔ Select Service map.
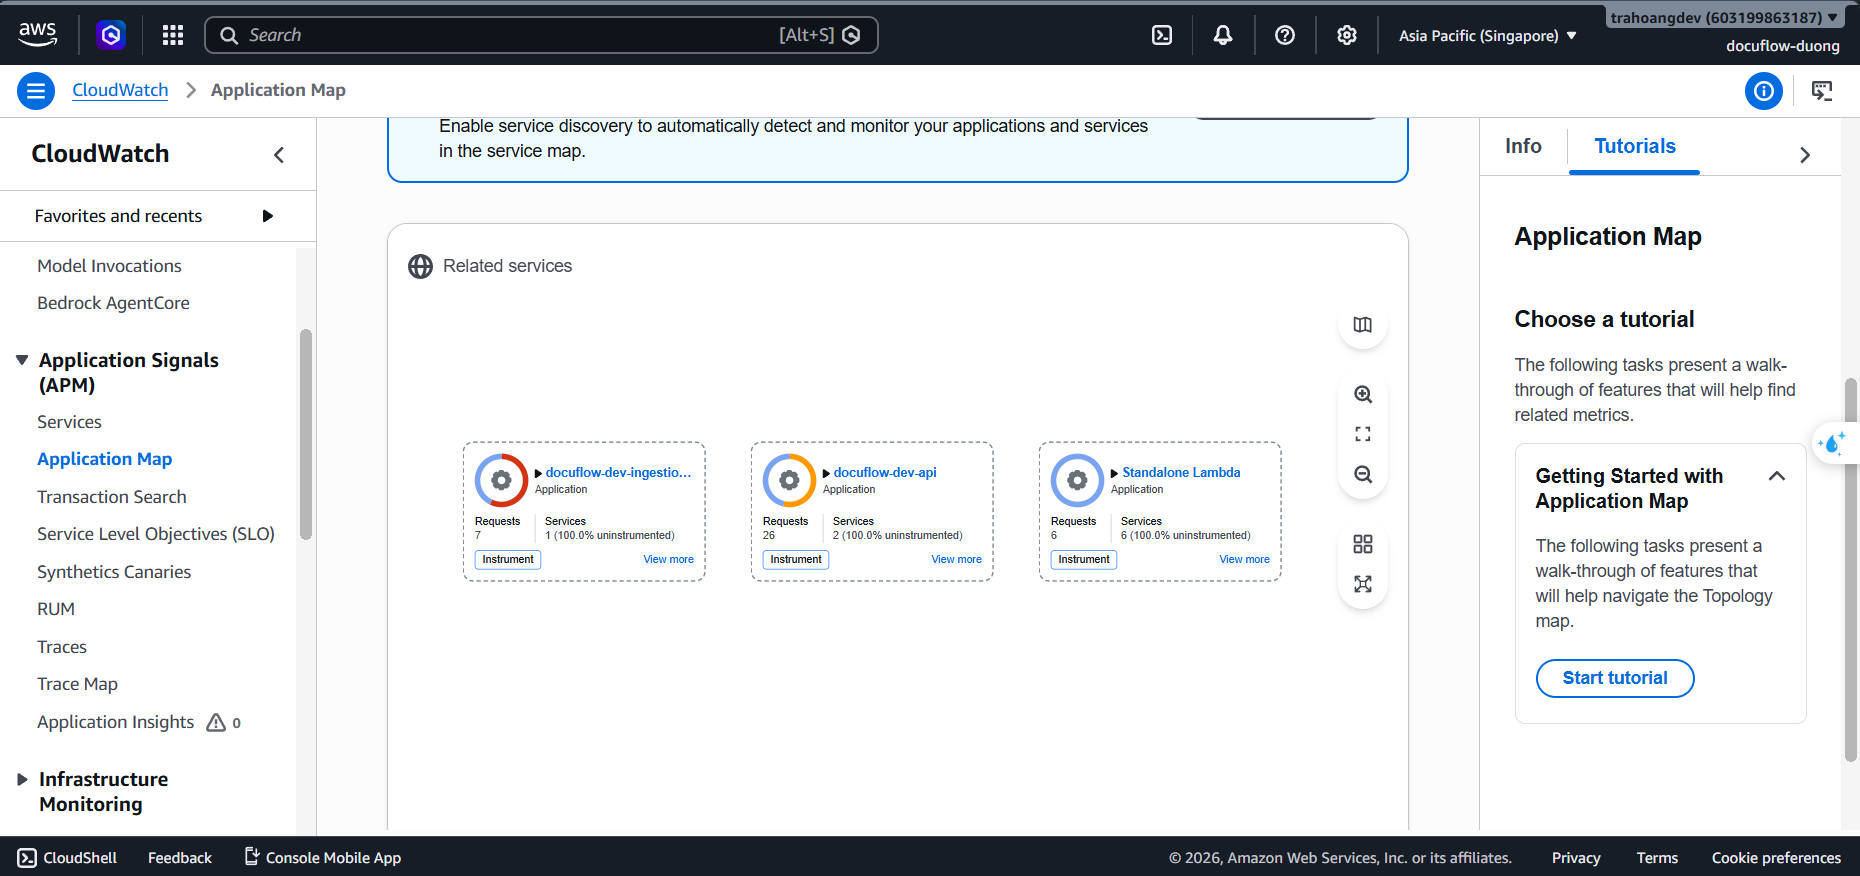
- After the system runs an invoice processing request, you will see an automated connection diagram formatted as a network map:
API Gateway ➔ Step Functions ➔ Lambdas ➔ DynamoDB / Textract. - A circle displaying green means it’s running smoothly; if it displays red/yellow, it means that step is experiencing errors or slow responses.